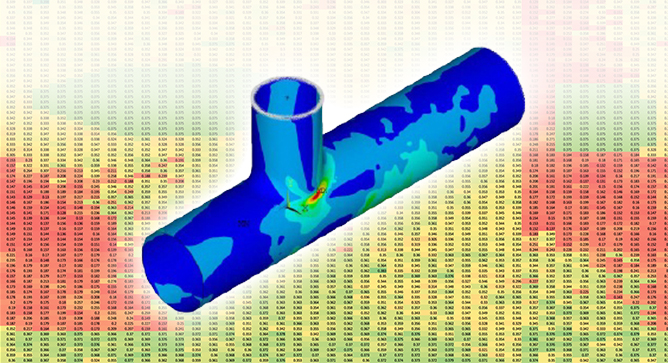
Life Extension of Raw Water Piping through Life Cycle Management Practices
By: Adam Roukema For nuclear power plants, service water (raw water) systems play a critical

By: Adam Roukema For nuclear power plants, service water (raw water) systems play a critical

Joint Industry Project: APTITUDE Flaw Evaluation Software By: Scott Riccardella, TJ Prewitt, Tyson Manning and

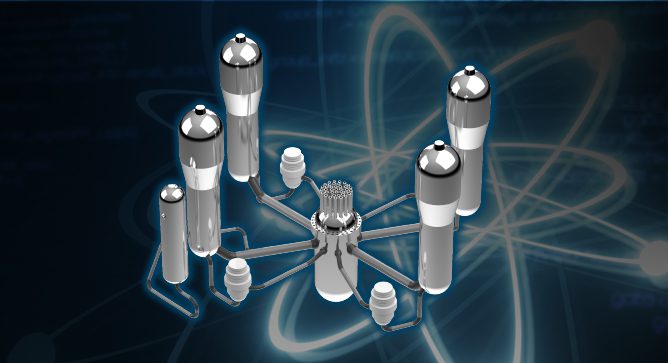
Nuclear plant aging management programs require periodic inspections of liquid storage tanks. Traditional inspection methods

CREEP FATIGUE IN STEAM COOLED BOILER AND HRSG TUBES By: Wendy Weiss Creep-fatigue is caused
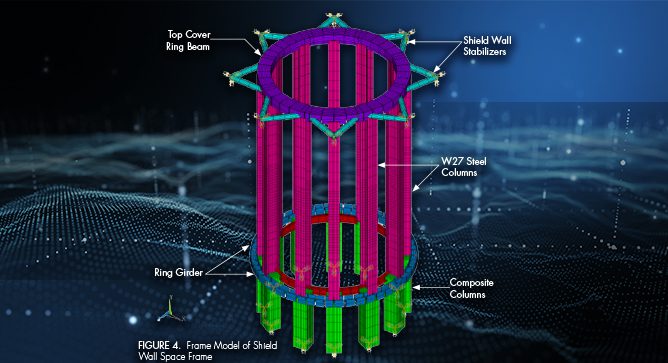
By: Julio Garcia, PhD, PE, Natalie Doulgerakis, PE, SE, Dan Parker, PE and Lachezar Handzhiyski

By: Ashkan Nejad, Ph.D. Ultrasonic cleaning is a non-destructive, low-cost technological method that uses high-frequency
By: Livia Costa-Mello, Shari Day, and Dan Denis Background Many U.S. nuclear plants are completing
By: John Hayden and Jason Van Velsor Our initial article on this topic in News
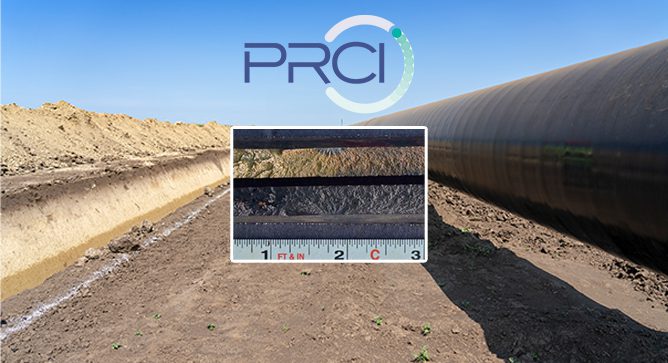
By Scott Riccardella and Steven Osgood Structural Integrity is pleased to be working with PRCI

Combustion Turbine Compressor Hygiene, Part 2