
News & Views, Volume 52 | Heat Exchanger Tube Sheet Reliability Analysis
By: Kannan Subramanian, PhD, PE, FASME & Dan Parker, PE
BACKGROUND
The hot section of a waste heat boiler, also known as the hot spent boiler, is an essential component in the regeneration of spent sulfuric acid in chemical plants that process sulfur. Due to the ever-increasing demand for sulfuric acid and other sulfur compounds, this is critical equipment as its operation results in sold-out production. As a result, these boilers need maximum uptime between scheduled maintenance outages; any unscheduled shutdowns to repair and/ or replace tubes and tube sheets directly translate into lost revenues for the plant. This article addresses the reliability issues of one such boiler located in a Louisiana chemical plant.
GOAL: Predict the minimum number of tubes to plug, minimize downtime and allow regular operation until the next planned maintenance.
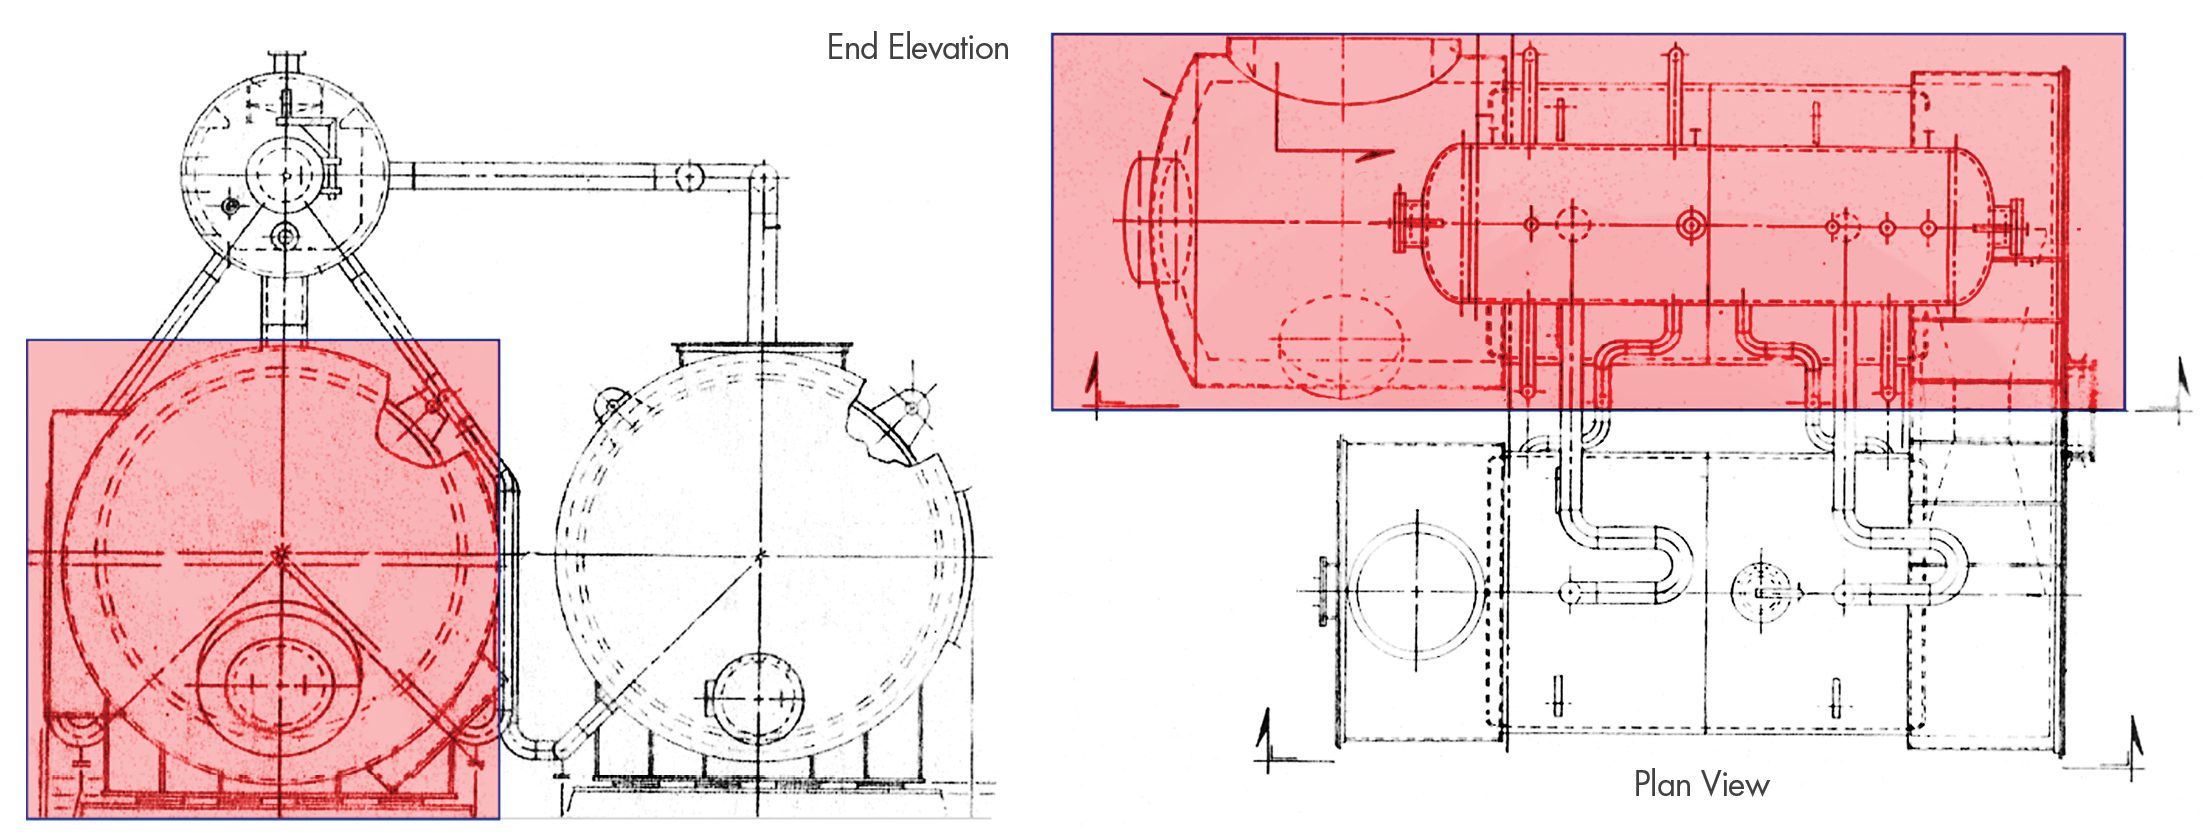
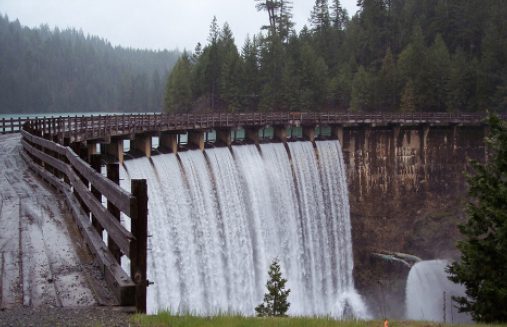
Figure 1. Hot Spent Boiler (shaded in red) in a waste heat recovery unit Flue Gas Tube Boiler.
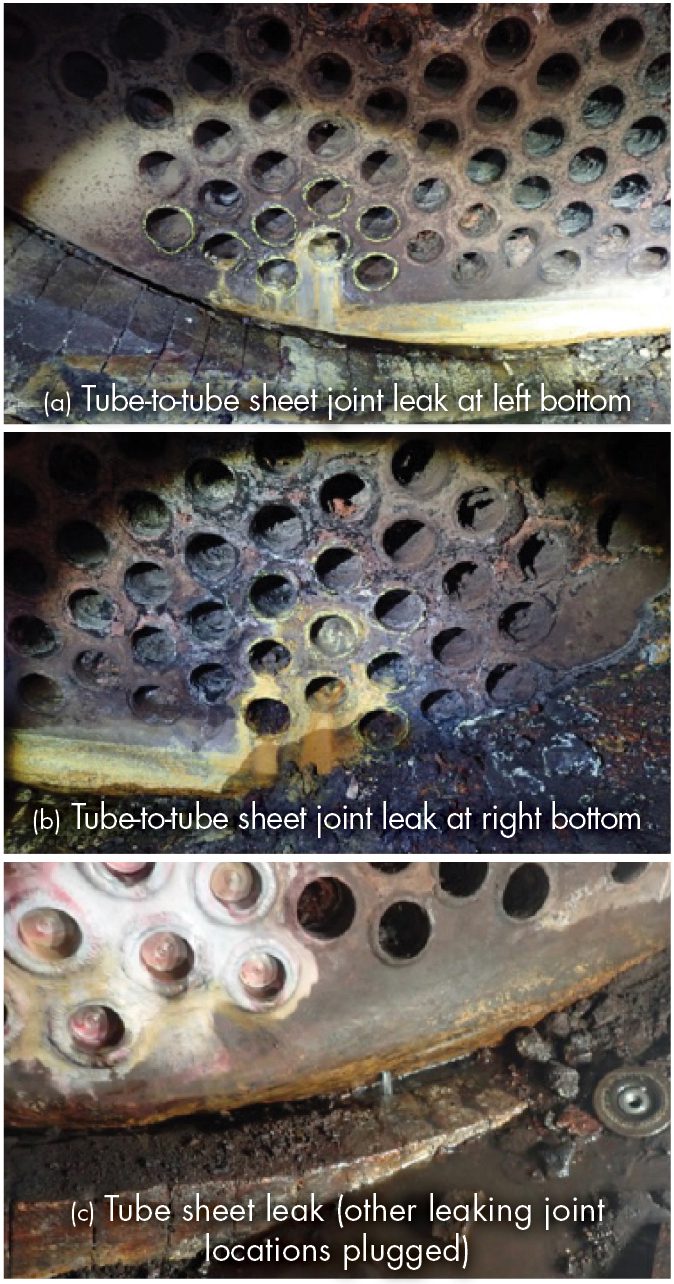
Figure 2. Tube-to-tube sheet joint failures and tube sheet leak
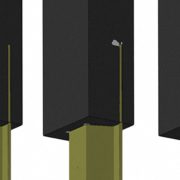
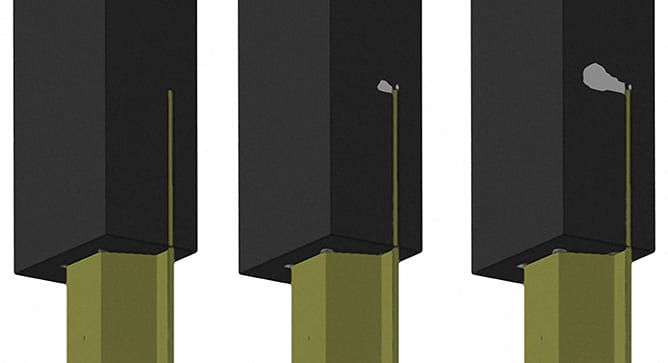
The boiler being assessed was part of an arrangement (Figure 1), with two fire tube boilers in parallel with a common external steam drum. In the case of the single boiler assessed by SI, the tubes were experiencing periodic tube leaks as the boiler was approaching the end of service life where tube failure frequency increases. As typical, there may be a single tube leak or several in the same proximity (Figure 2). Some proactive plugging has been applied based on historical performance (Figure 3(a)). In SI’s experience, tubes adjacent to a plugged tube may fail a short time after the plug is installed as there is an undefined temperature/stress interaction. In addition to tube leaks, general corrosion and tube sheet thinning can be a consequence of tube leaks (Figure 2(c). Excessive tube sheet thinning is not uncommon due to the formation of sulfuric acid that exacerbates the corrosion issue. With these consequences in mind, it is critical that the proper number of tubes be plugged to stop the costly cascade of failures.
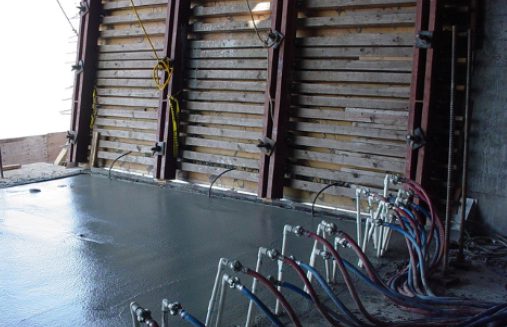
To bring the boiler back to service, in early January of 2022, the leaking tubes and a few other tubes around the leaking tubes were plugged. In addition, to repair the leaking location in the tube sheet knuckle region, welding followed by post-weld heat treatment was performed (Figure 3(b)). Within a few weeks after this repair, additional tube leaks were discovered and required plugging. Such frequent leaks and repairs result in production loss and unplanned expenses. To minimize those, SI was contracted to develop an engineering basis for tube plugging, which would be proactive for equipment reliability, but not produce over-plugging that affects the boiler heat duty. To achieve this, the engineering assessment should involve an advanced analytical study to understand the following:
- Tube leaks
- Effect of repair, PWHT, and additional plugging on adjacent unplugged tubes
- Effect of tube sheet metal loss on the integrity of the tube sheet
This article covers both the historic details of the failures and subsequent repairs and provides a comparison of the failures documented on-site with the analytical results determined from the approach implemented by SI.
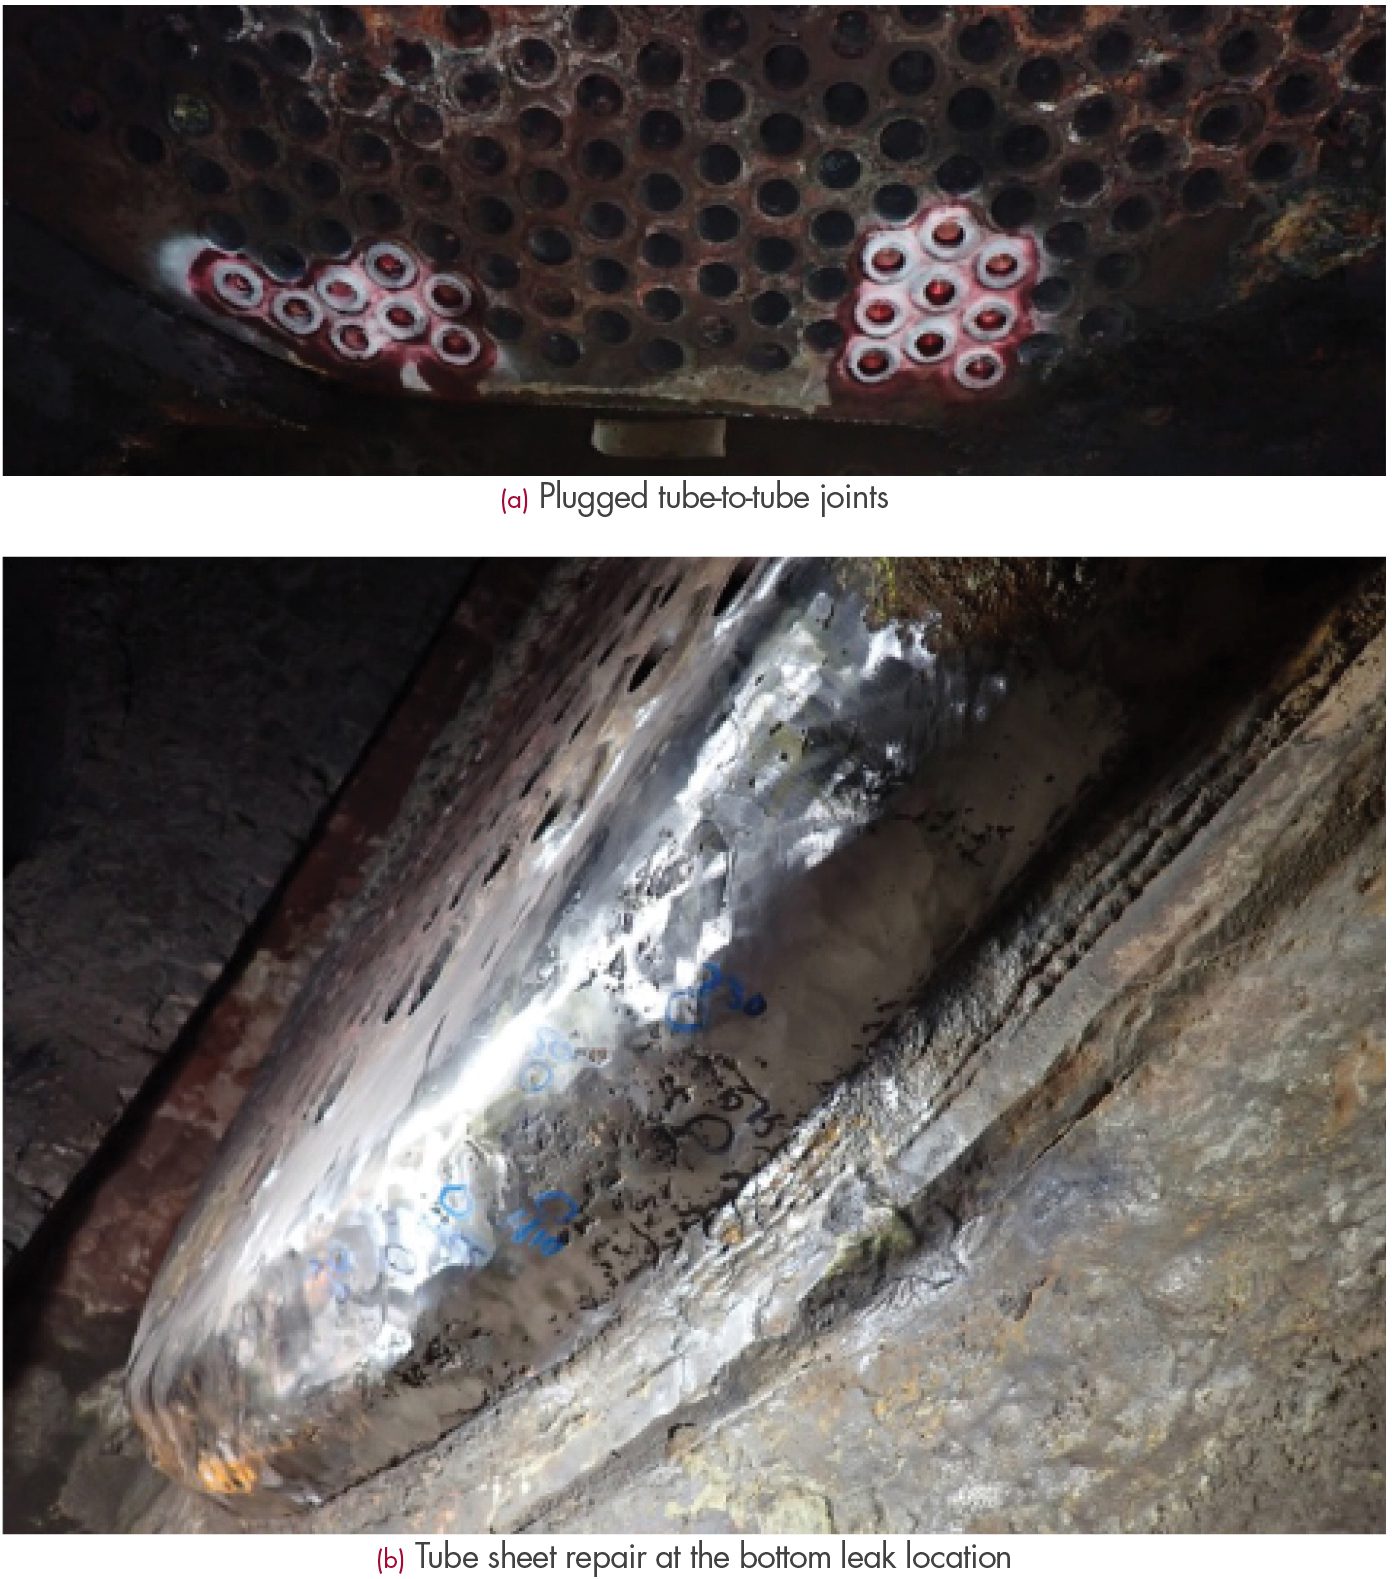
Figure 3. Hot Spent Boiler Plugging and Repair Welding
METHODOLOGY & CRITERIA
The overall approach adopted by SI:
- Develop finite element (FE) model to study design deficiencies, if any, using elastic analyses. That is, perform an elastic finite element analysis (FEA).
- Develop a criterion to study the tube-to-tube sheet integrity.
- Using the same FE model, perform elastic-plastic analyses to determine the effect of repair and PWHT.
- This is to determine if any additional tubes should be plugged to reduce any adverse effects.
- This is a sequentially coupled thermal-stress analysis.
- Calculate the minimum required thickness for the various sections of the waste heat boiler.
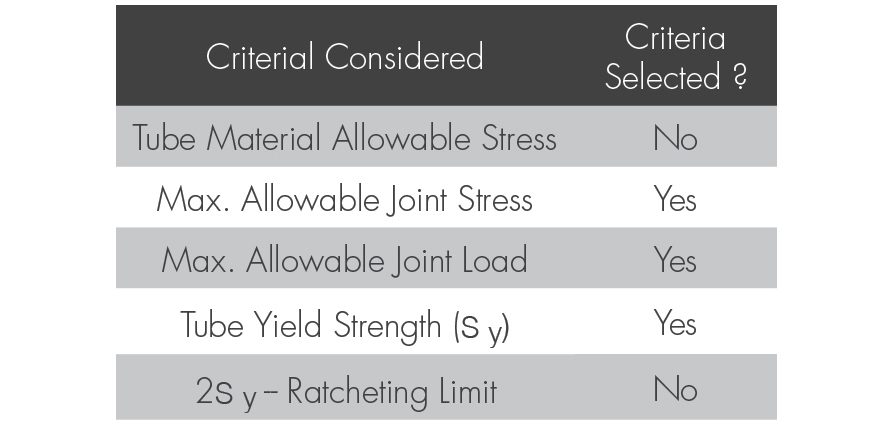
Table 1. Criteria Used in the Analyses
Table 1 illustrates the criteria considered for the work described herein. Several stress magnitudes were considered, such as the tube material allowable stress, tube-to-tube sheet joint allowable stress, and the ratcheting limit. Typically, when elastic analyses are performed, ratcheting limits are helpful. However, this work did not utilize the ratcheting limit. The tube-to-tube sheet joint allowable stress and load are calculated using Section VIII, Div. 1, Nonmandatory Appendix A. The allowable stress and load are compared against the equivalent stresses and tube axial loads, respectively, from the FEA to determine the mechanical integrity of the tube-to-tube sheet location. However, since there exists a parallel damage mechanism (general corrosion), the yield strength of the tube is set as a limit to add conservatism.
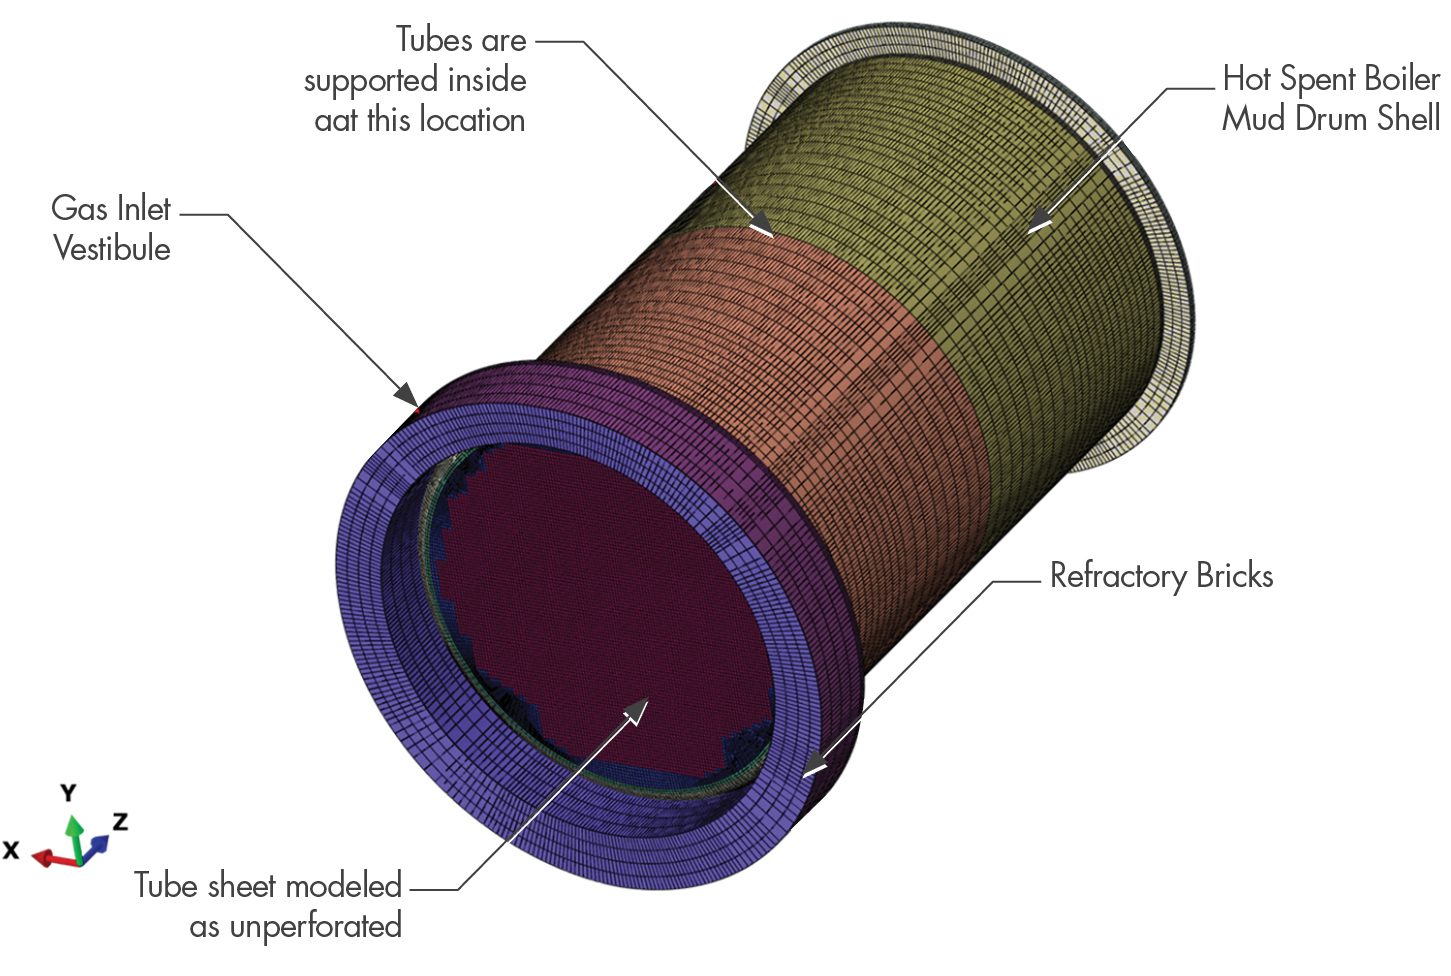
Figure 4. Hot Spent Boiler as Modeled in FEA
ANALYSES & RESULTS
Since the methodology requires the use of advanced analytical methods, an FEA model (Figure 4) was built and analyzed using the commercial FEA software package – Abaqus. The model included sufficient lengths of gas inlet and outlet sections, the tube support location at the mid-section of the mud drum, the refractory, and the brackets that connect the hot section with the boiler drum. Since the nozzles are far from the area of interest, they are not included in the model. Appropriate element types were utilized for this work. One notable feature is the use of beam elements for the tubes (Figure 5). Since the model includes hundreds of tubes, incorporating a solid tube and heat exchanger model adds both geometric and numerical complexity. The use of beam elements simplifies the model while significantly minimizing the numerical convergence issues when compared with the full solid models.
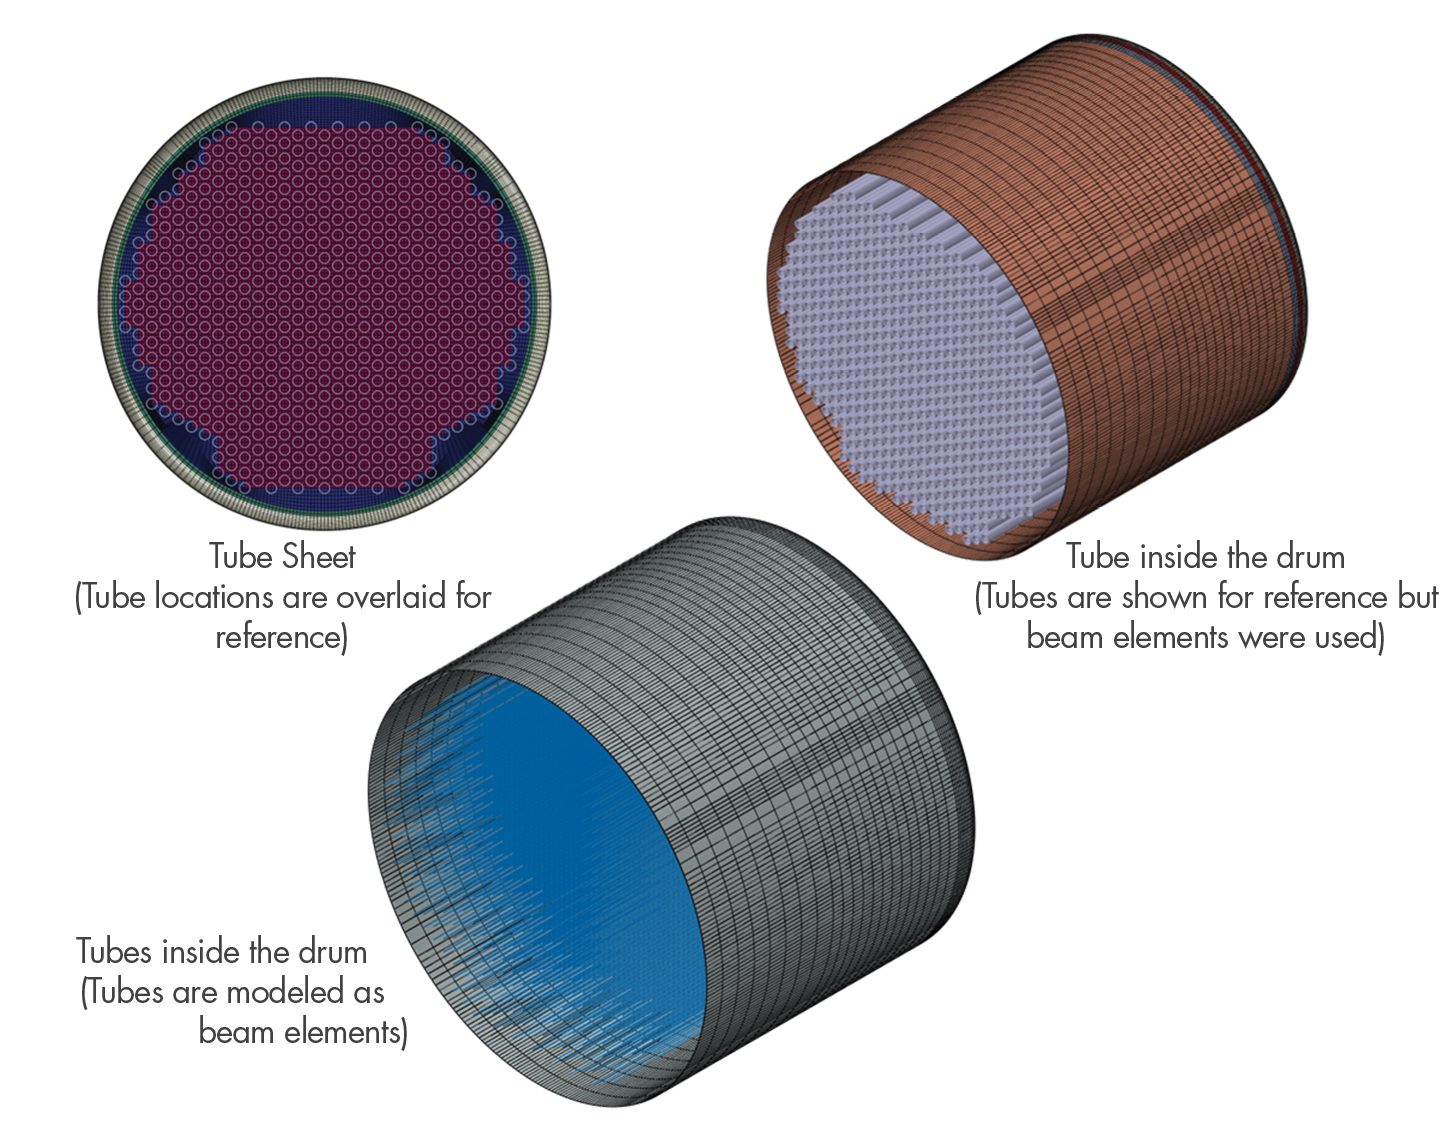
Figure 5. Hot Spent Boiler Tubes Inside the FEA Model
All the analyses performed are thermo-mechanical analyses, wherein a heat transfer/thermal analysis is performed first, and the temperature profile from the thermal analysis is imposed along with respective mechanical loads in the subsequent stress/mechanical analysis. Initially, elastic models were used to assess the design adequacy of the subject boiler and to determine the bounding operating conditions for further analyses involving the repair process. For the analyses involving the weld repair and the post weld heat treatment (PWHT) followed by operating conditions, the sequence of steps is critical. SI discussed the methodology with the client when developing the accurate sequence to be included in the FEA. As stated earlier, to capture the effect of residual stresses (after welding and PWHT processes) on the corroded tube sheet section at the bottom where the leak was discovered, an elastic-plastic FEA is essential. Temperature results from the welding process step are shown in Figure 6. After welding and PWHT, the process conditions were applied to the model along with the number of plugged tubes at the time. Figure 7 illustrates the temperature distribution in the tube sheet, boiler drum, and tubes. Since the plugged tubes do not transport flue gas, the temperature of those tubes is the same as the water temperature around those tubes inside the drum.
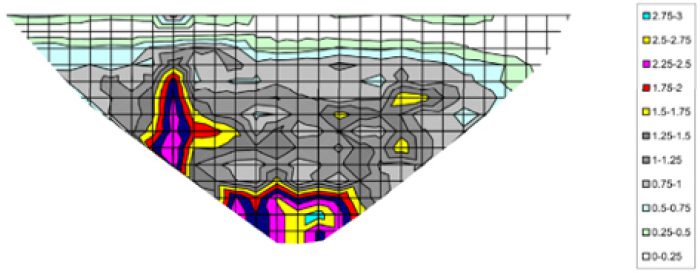
Since the number of tubes is significant, post-processing of results is a challenge. SI developed a procedure to overlay the von Mises equivalent stress results on a spreadsheet layout that resembles the actual tube layout in the tube sheet. It is further simplified for better visualization in this article, as shown in Figures 8 through 10. Figure 10 (a) shows a historical perspective of the tube plugging over time. In the first set of analyses that SI performed, only the locations shown with greyish blue color (tubes plugged before Jan. 2022) were considered as plugged. The thermal analysis results for this case are shown in Figure 7. After performing the mechanical/stress analysis, it was observed that the unplugged tube locations shown in Figure 8 (a) with orange and red dots are of concern. The orange dot locations indicate the locations with stresses greater than the tube yield strength. The red dot locations indicate that the stresses exceeded the allowable stress. Since the criteria are set at joint location stresses exceeding the tube allowable stresses, both orange and red dot locations require tube plugging. Figure 8 (b) shows the locations where further tube leaks were discovered within weeks of the weld repair and plugging. The tube leak locations are identified with yellow marks. This gives the confidence that such analytical methods, when appropriately applied, can predict the locations of future failures.
Figure 6. Repair Welding Simulation – Heat Transfer Analysis
Figure 7. Post Repair and Plugging Process Conditions – Heat Transfer Analysis
After the discovery of the new leaks, further plugging was undertaken. These locations are identified by light blue dots in Figure 10 (a). SI incorporated these changes in the analyses and determined that the locations shown in red and orange dots in Figure 8 (a) are still a concern, as shown in Figure 9 (a). This was later confirmed by further tube leaks (see Figure 9 (b)) found after 6 weeks of the previous plugging was completed. This further assured the value of performing such an engineering-based approach rather than a traditional grand-fathering approach which would use plugging methods adapted for similar units based on historical information. It should be noted that SI was engaged in this study at the period between weld repair and second set of plugging as shown in Figure 8. However, all the results were made available just prior to the third leak shown in Figure 9 (b). At this time, the Client utilized the results from the FEA and decided to add additional tube plugging as shown in Figure 10. SI performed analyses with the final set of plugging, and the results indicated that other tube locations around the plugged tube locations are not of concern (see Figure 10 (b)).
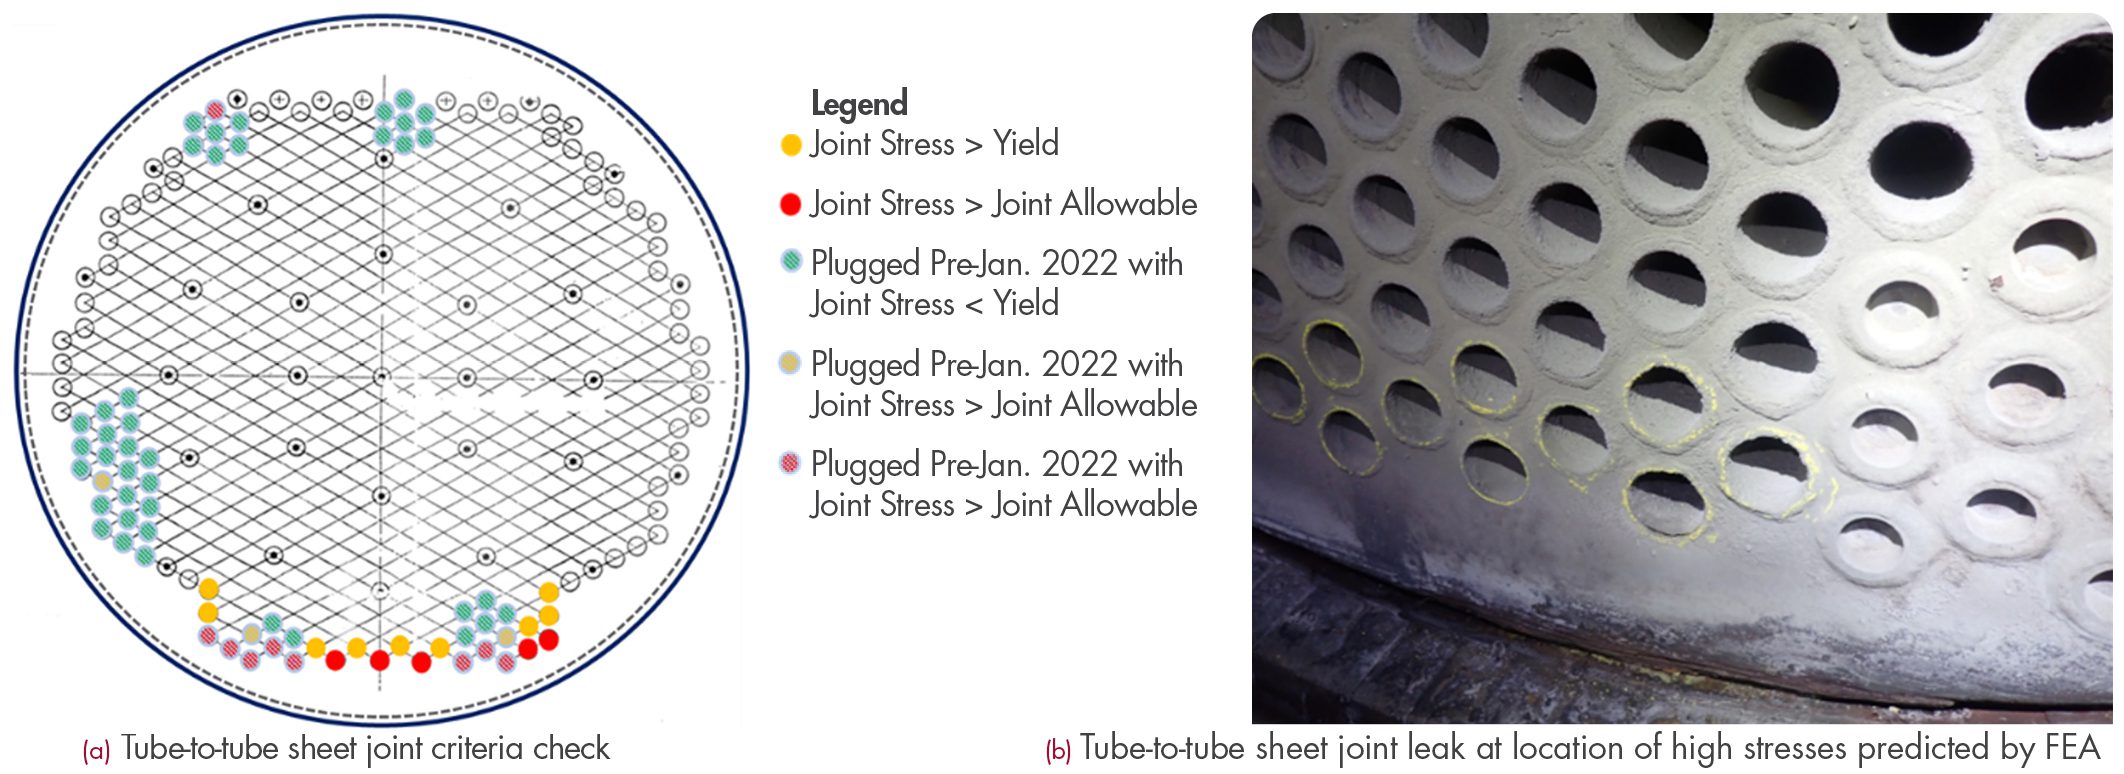
Figure 8. Post Repair and Plugging Process Conditions Criteria Check and Field Observation
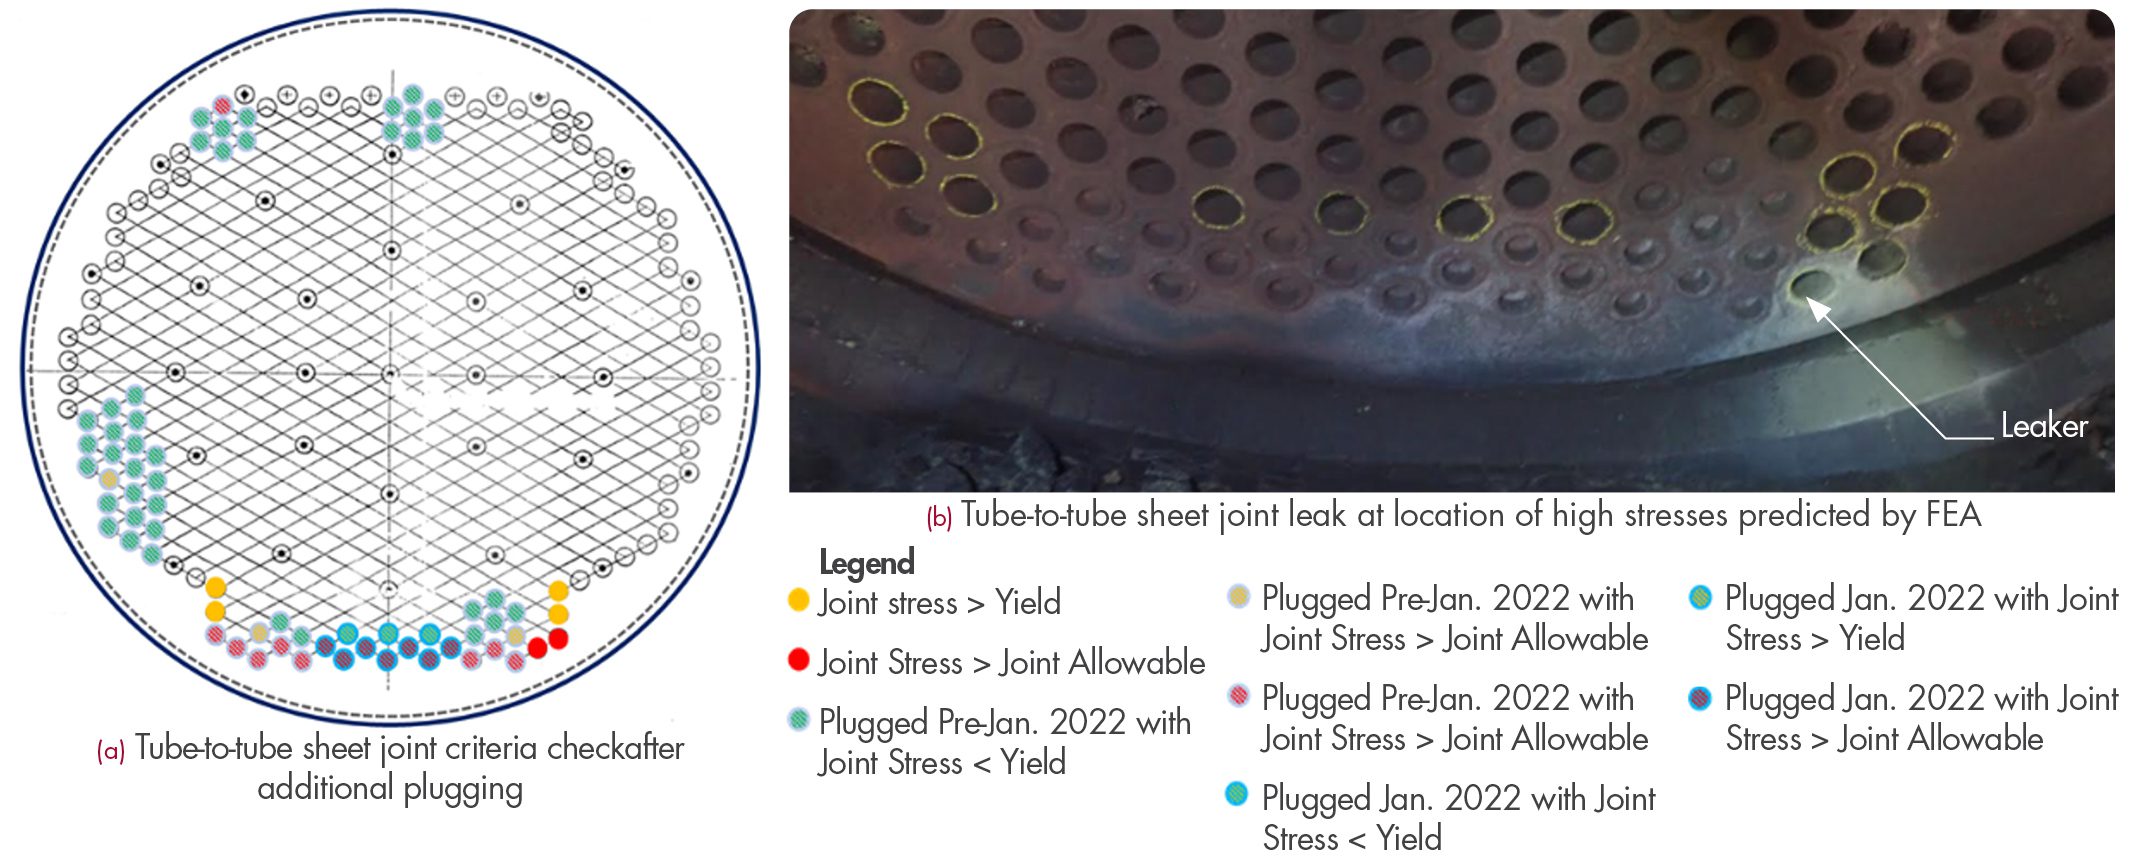
Figure 9. Additional Plugging and Field Observation after that Plugging
The last set of analyses were performed in mid-March of 2022, and after 6 months, the boiler did not experience any further leaks. While the engineering approach predicted the issues, it is cautioned that any engineering analysis can only simulate the known degraded material thickness and properties in the analysis and not the corrosion degradation mechanism itself. The rate of deterioration and the interaction of various damage mechanisms should be monitored by the operator.
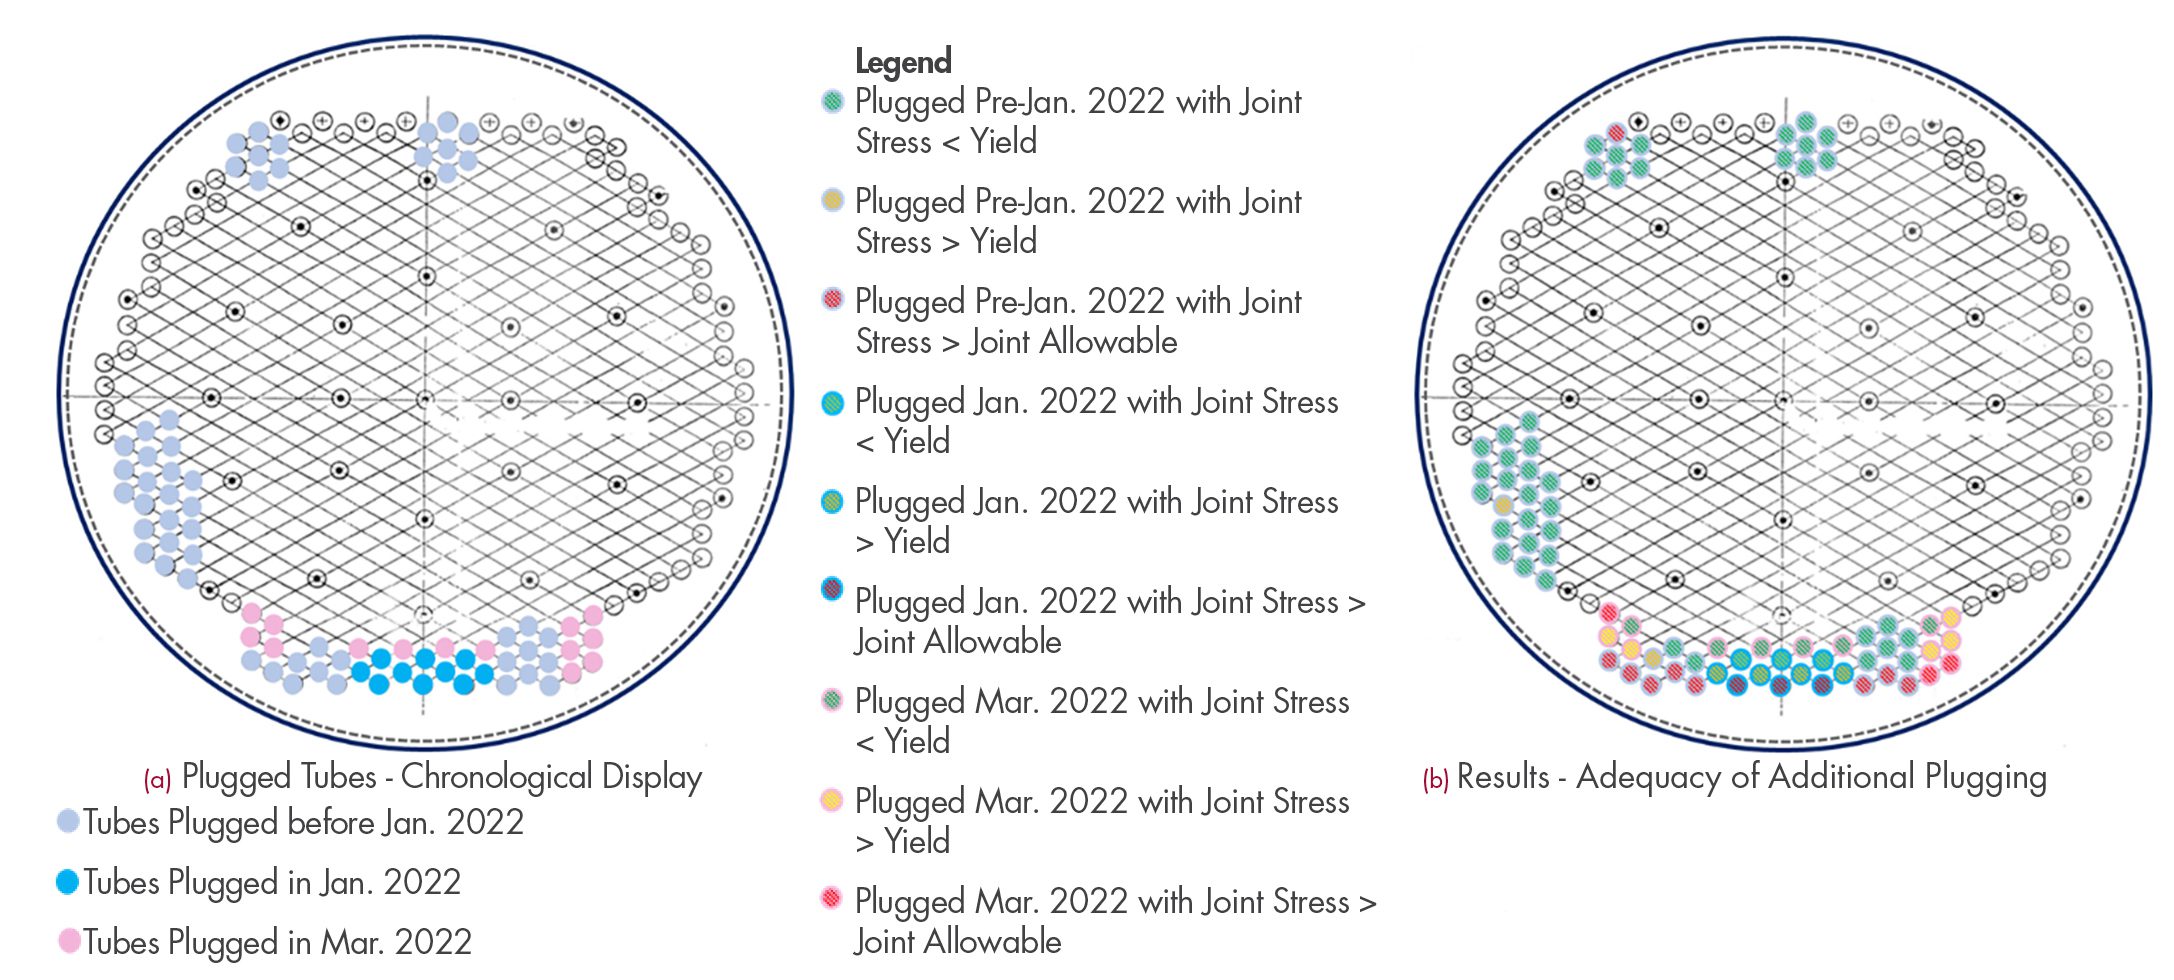
Figure 10. Tube plugging to-date and tube-to-tube sheet joint stress state
CONCLUSIONS
- The original, as-installed condition did not show significant issues. It is believed that other damage mechanisms caused the initial failures leading to the plugging of tubes around the periphery of the tube sheet.
- The study captured the recent joint issues, specifically the failure after the plugging and repair weld performed in early January 2022.
- Thinner regions are more prone to further failure. The minimum required thickness using the same criteria is established for the tube sheet.
- The analysis was successful in predicting the minimum number of tubes to plug.
- Plugging the correct number of tubes stopped the typical tube failure cascade.
- The applied results were directly proven. Once the results were fully implemented, the waste heat boiler had no unplanned shutdowns. The analysis met its goal and provided a major business impact.
- Analysts need sufficient information to minimize assumptions and make a robust model.
- Clear understanding of API 579, ASME Section VIII Div. 1, ASME Section I, and FEA is necessary to develop robust, realistic, and relevant engineering solutions.


 In 2018, Structural Integrity Associates, Inc. (SI) supported the United States Army Corp of Engineers (USACE) in the structural assessment of the concrete-to-steel connection in typical I-Section flood walls. A representative flood wall section is shown in Figure 1. This effort was part of a broader scope of work in which the USACE is revising their guidance for the design of flood and retaining walls, EM 1110-2-6066.
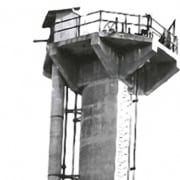
 In 2018, Structural Integrity Associates (SI) supported a utility in the structural assessment of a submerged concrete intake tower.