News and Views, Volume 55 | Digital Twins – Concept, Uses, and Adoption in Industry
By: Sarbajit Ghosal, Dick de Rover, and Abbas Emami-Naeini
Digital Twins are dynamically synchronized digital representations of physical equipment or systems. This technology is emerging in the power generation industry and assists with early detection of potential failures, failure accommodation, optimized maintenance schedules, development of next-generation equipment, and workforce training.

SC Solutions has decades of experience with technology that powers devices in your pocket and on your desk and continues to be an industry leader in providing process control solutions to the semiconductor industry. SI Solutions brings together the combination of SC’s controls expertise with that of Structural Integrity’s, modeling expertise and highly capable AIMS platform cyberinfrastructure, cultivating the total package to handle the development of digital twins in critical infrastructure.
Origin of the Digital Twin Concept
On April 13, 1970, while 210,000 miles from Earth, the three astronauts in Apollo 13 were startled by a loud bang that shook their tiny spacecraft. Astronaut John Swigert immediately messaged the NASA Mission Control Center: “Houston, we’ve had a problem here.” One of the two oxygen tanks had exploded catastrophically, damaging the other tank and thus putting the astronauts in extreme danger. The mission had to be aborted.
NASA engineers and scientists in Houston worked feverishly around the clock to devise a way to bring the astronauts back safely. They were assisted by 15 simulators used to train astronauts and mission controllers in every aspect of the mission, including multiple failure scenarios [1]. These simulators, made up of high-fidelity models, had been developed at NASA in the 1960s as “living models” of the mission [2]. They were controlled by several networked computers, e.g., four computers for the command module simulator and three for the lunar module simulator [1]. By utilizing these simulators and real-time sensor data from the spacecraft, Mission Control devised a successful strategy to guide the astronauts back to Earth safely.
While the term “digital twin” was coined later, the Apollo 13 mission is widely recognized as the first application of this technology, where a digital version of a physical system was updated with sensor data which was then used to run simulations to test potential solutions to troubleshoot a complex, high-stakes problem in real-time.
What Exactly is a Digital Twin?
Claims of using digital twins to solve various problems and marketing supposed digital twin products have proliferated over the past seven years. The term’s use to describe virtual representations of all sorts of assets, ranging from cities to racing cars, has led to considerable confusion. Experts from academia, industry, government agencies, and standards organizations have published definitions describing the key features of digital twins to mitigate confusion [3]-[5].
Since the definition often gets bogged down in semantics, it is preferable to identify the three primary parts that constitute a digital twin (DT). They are the physical object or process and its physical environment, the digital representation of this object or process, and the communication channel between these two that helps maintain state concurrence of the digital representation even as the state of the object or process changes dynamically. This communication channel transmits sensor data and state information and is called the digital thread. It is noted that a static model of a system or process cannot be a DT. A dynamic model whose parameters are not updated to reflect changes in the physical counterpart of the model also cannot be a DT.
The International Organization for Standardization (ISO) adopted a concise yet complete definition of a digital twin in 2021. The standards document on the digital twin framework for manufacturing (ISO 23247 [5]) defines a digital twin as a “fit-for-purpose digital representation of an observable manufacturing element with synchronization between the element and its digital representation” [6].
Whether maximizing machine performance or preventive maintenance, a clear goal for the twin is necessary for selecting the states of interest and a corresponding model of sufficient fidelity.
A digital twin of the next-generation machine, a digital twin prototype (DTP), incorporates its physical twin’s design specifications and engineering requirements. The DTP is valid in the design phase before investing resources to build a hardware prototype. DTP simulations help designers decide whether the eventual prototype would meet performance specifications. Once the prototype is fabricated and operational, the corresponding DT, now updated with sensor data, is called the digital twin instance (DTI). A collection of DTIs with a standard function is called a digital twin aggregate (DTA). DTA’s may be a collection of digital twins of the same equipment, e.g., several nominally identical pumps in a hydroelectric power station, or different equipment with a common purpose, e.g., robots, conveyors, and quality inspection stations in a material handling system of a factory.
Additionally, a simulation with a DT does not necessarily have to be performed in real-time—it would depend on the application. A DT used for real-time system control must run faster than real time. However, a high-fidelity DT used for design optimization may run simulations over many hours to sufficiently probe the parameter space in its underlying models.
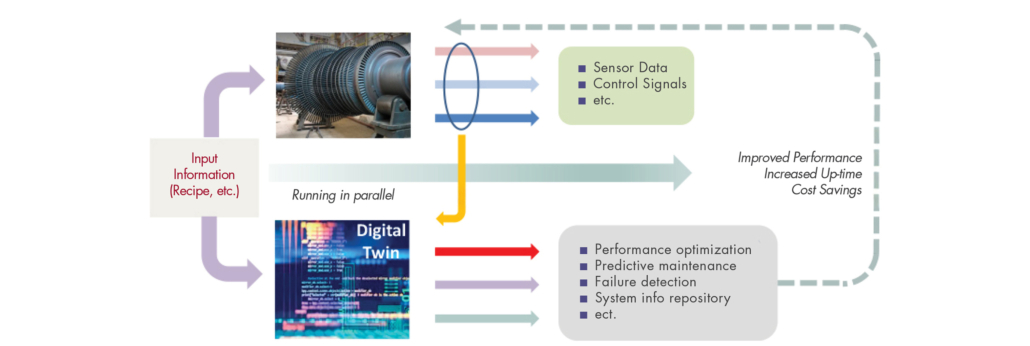
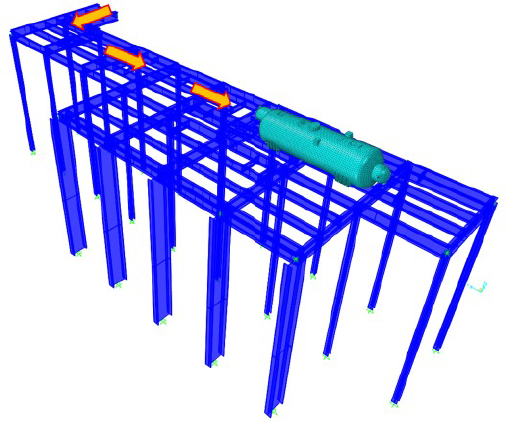
Figure 1. Digital twin (DT) of a power generation equipment operating in parallel with its physical twin.
DTs have three key aspects: model, data, and services, i.e., services used or provided by DTs. The software that makes up the DT of a system has different functionalities that address these three aspects. We have divided the software into six broad classes:
Six Classes of Software used in a Digital Twin System
Software implementation of models: These may be physics-based models or gray box models (a combination of physical subsystem models and input-output heuristic models) of the physical components that may be integrated to create the system DT. The physics-based models are low-order versions of complex finite-element models that run simulations faster than in real-time. The gray box models combine known physical/mathematical relationships (the system model – the “white box” part) with phenomenological relationships or black-box models such as artificial intelligence/machine learning (AI/ML) that replace physics too complex to be modeled or overlooked. One example of gray box models is surrogate models such as Gaussian process models and physics-informed machine learning (PIML).
Sensor data-related software: This group includes software for signal processing and noise filtering of the sensor data. The data acquisition frequency may vary from milliseconds for real-time sensor data to hours for statistically sampled measurements of attributes of a manufactured product. Depending on the number of sensors and sampling rate, the volume of data may be substantial, especially in a manufacturing application. There is also software for interacting with external databases that would organize and store the data, make them available for updating the DT, and help perform prognostic tasks. This class of software would also include the implementation of sensor fusion algorithms and data compression algorithms.
Analytical and prognostic software: This class of software provides the DT’s “intelligence” and its benefits to the user. It includes the implementation of predictive maintenance algorithms, system performance optimization, decision support, and anomaly detection. Also included is software for updating models with sensor data by estimating new model parameters or re-training machine learning networks.
Software that enables user interaction: A well-designed user interface is key to digital twins gaining wider acceptance. A DT should include tools for customizing dashboards and interactive control interfaces, 3D graphics libraries for visualization of the physical twin at different levels of detail, and reporting tools for its prognostic and related functions. Some DTs may benefit from using augmented reality/virtual reality (AR/VR) tools.
Network communication and security software: This software is part of the so-called “digital thread” that involves all aspects of securely dealing with data streaming from hundreds, if not thousands, of sensors. Tasks performed by such software would include message queuing, protocol translation, connection monitoring, API management, and, very importantly, network security. For DTs to gain trust, the intellectual property (IP) embedded in the DT and in the data must be protected against all cyber threats.
Administrative software: This group includes “everything else”! It provides software and tools for configuration and change management, requirements tracking, documentation, access control, resource monitoring, and backup.
Drivers for Digital Twin Development
The confluence of advances in four technological factors has driven the development and adoption of digital twin technology over the past decade. These factors are:
- The decreasing cost of high-performance computing (HPC), both at the edge (i.e., in physical proximity to the end-user or the physical twin) and in the cloud. While problematic limitations imposed by physics and manufacturing costs have slowed Moore’s Law, computational power has continued to increase through a combination of heterogeneous integrated circuit (IC) architecture, such as 3D stacking and chiplets, and chips designed for a specific use, such as graphics processing units (GPUs).
- The proliferation of sensors and sensor networks (sometimes called the Internet of Things or IoT) enables individual sensors to acquire, flow and store data. Data analysis makes it possible to monitor a variety of system attributes, which, in turn, allows the digital twin to keep up with changes occurring in its physical twin.
- Availability of software tools enabling faster development of more complex models. Modeling techniques have been developed to use different models, including physics-based, data-driven, and machine learning (ML) models, to create a more comprehensive and accurate digital representation of the physical system. Merging various modeling approaches helps capture a more precise view of the physical system by leveraging the strengths of each model type. Commercial modeling software such as ANSYS also provides tools to develop surrogate models, proxies for high-fidelity physics-based models, and speed up model simulations [7].
- The arrival of large language models (LLMs) developed in the field of generative artificial intelligence. Before the release of ChatGPT to the public in November 2022, the role of AI in digital twins was primarily in using supervised machine learning for surrogate and data-based models. LLMs have advanced “embedding” capabilities, i.e., they can significantly compress data (both numeric and text) while retaining essential information. For example, in a manufacturing setting, LLMs can organize data from maintenance logs, equipment images, and operational videos and make them available in a DT. Maintenance logs often have valuable information related to system failure diagnostics and health maintenance that would add to the DT’s capabilities. AI is expected to play an essential role in the future of digital twin technology.
The fast-paced progress made in the above technologies makes it possible to transform digital twins of complex systems from merely a nebulous concept to a valuable technology that can be implemented once a few hurdles (such as standardization and data sharing) are overcome. Figure 2 attempts to show how the digital twin concept has evolved from solid models and offline computations to the virtual representations of complex systems being developed.
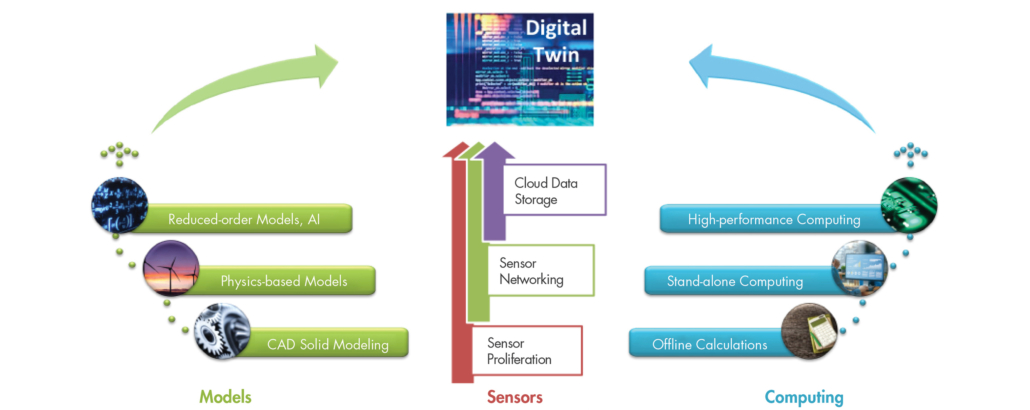
Figure 2. Factors in the evolution of digital twins.
How Can Digital Twins Be Useful?
The holy grail of digital twin technology derives from its ability to monitor the health of its physical twin, and the benefits include the following:
Early detection of potential failures: While sensors in the physical twin can monitor the system’s local state in the proximity of the sensors, the digital twin’s states act as virtual sensors and effectively scan the state of the entire system and can detect anomalous behavior. When the DT incorporates reliable degradation models (e.g., heater degradation or crack propagation), it can predict potential failures. The process cycle may then be ended in an orderly manner to repair or replace the part without any damage to the system that may result from a catastrophic failure of the part.
Failure detection and accommodation: The digital twin can be a valuable tool in case of a component failure in equipment. There are different ways to perform such root cause analysis. One way is to use physically meaningful model parameters continually monitored by sensor data estimation. If a parameter value strays outside a specified range, the failure is related to the component associated with that parameter. A second method uses a bank of Kalman filters to detect anomalies. The second article in this series will examine failure detection for sensor and actuator failures in a rapid thermal processing (RTP) system in greater detail.
As an example of using DT for failure accommodation, if a temperature sensor fails in the RTP system, the DT’s estimate of the system’s temperature near the sensor (one of the DT’s states) can temporarily serve as a virtual sensor. The process can continue until the faulty sensor is replaced during regular maintenance.
Optimizing maintenance schedules: Currently, scheduled maintenance of equipment is more frequent than needed to avoid unplanned downtime. The ability to foresee some potential problems down the road allows a factory to implement predictive maintenance strategies to reduce cost by eliminating unnecessary maintenance.
Develop Next-Generation Equipment: The digital twin of an existing asset may be modified to help speed up the development of next-generation equipment. Simulations run with the latter are very helpful in determining whether the design would meet the desired performance goals. Design changes are fast and inexpensive to implement and test in virtual space, and they can help ensure that the prototype built would meet all the requirements. SC has used this approach with its equipment models, which are components of the equipment DT, to help its customers design and build next-generation equipment.
Workforce Training: Since the roots of digital twins go back to NASA’s simulators for training astronauts, it is not surprising that DTs are finding a role in the education and training of the industrial workforce. Here, DTs can provide an immersive learning experience and practice with virtual control of tools to run real-time simulations, often aided by virtual reality accessories. Like other digital educational tools, DTs have the advantage of offering customizable learning, distance learning, and a safe environment without any accidents resulting from incorrect operation. Finally, DTs can be used for scenario-based training dealing with various operational conditions, equipment failures, and emergency response training. While the prognostic applications of digital twins require very frequent updating with sensor data, the DTs for other applications need significantly less updating.
Potential Applications for Digital Twins in Power Generation and Other Critical Infrastructure
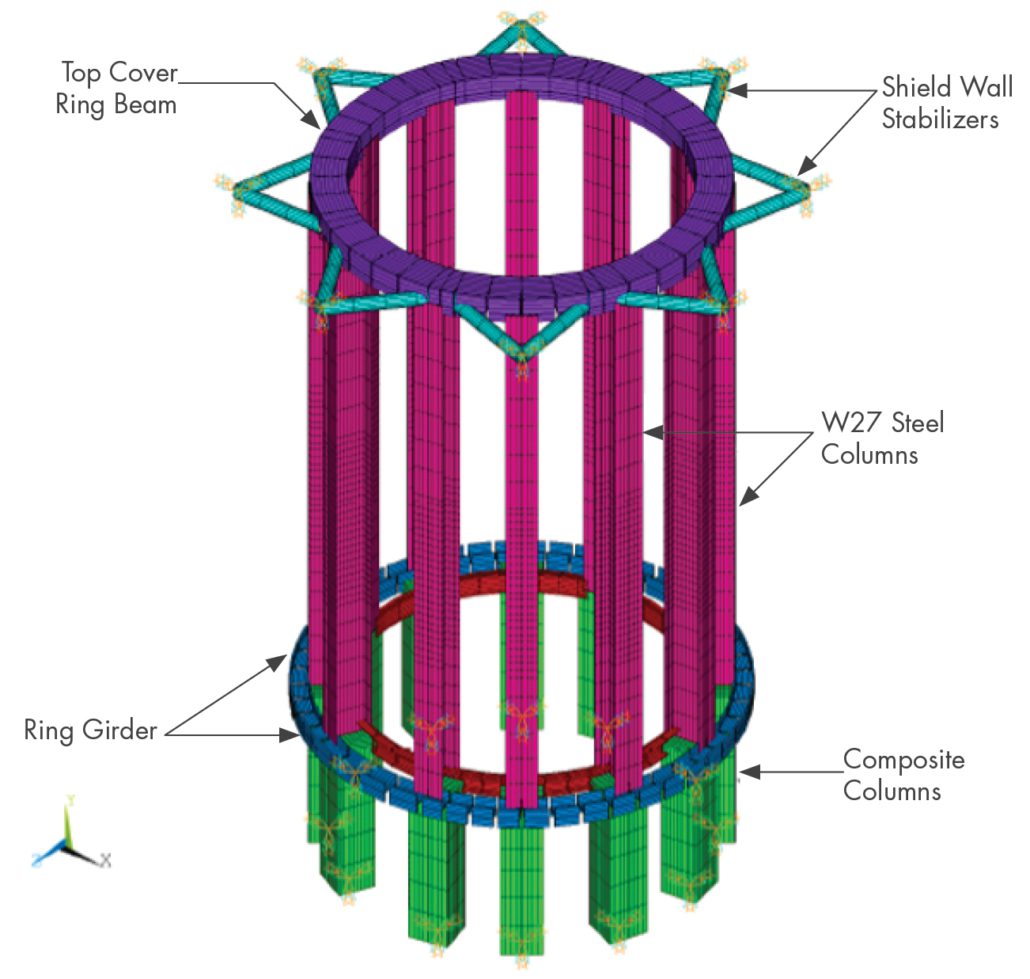
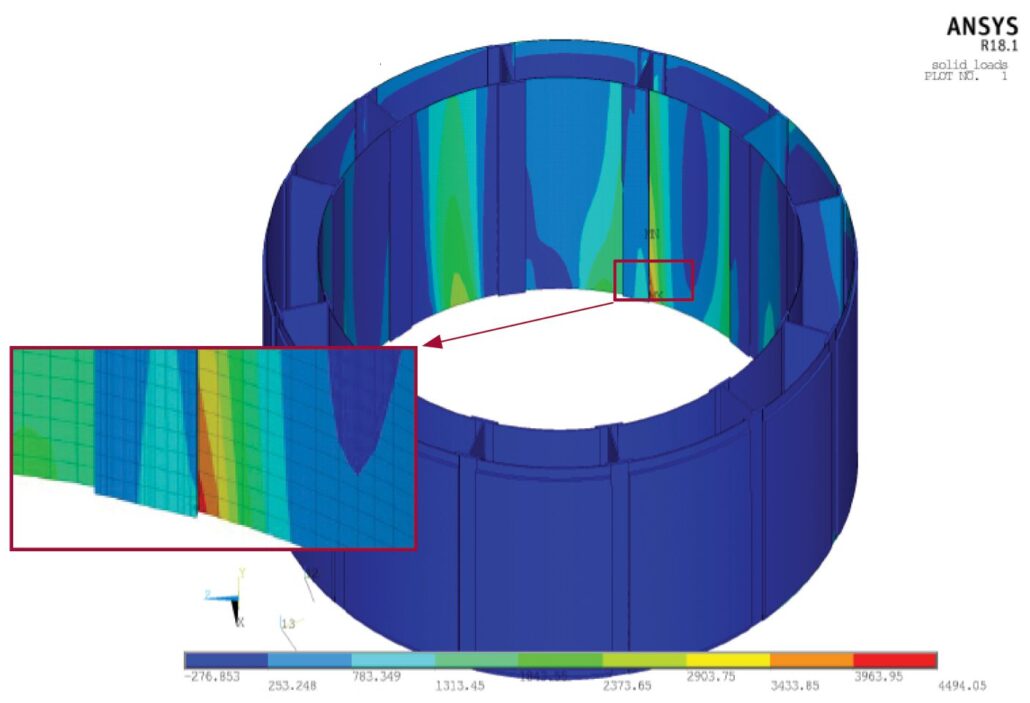
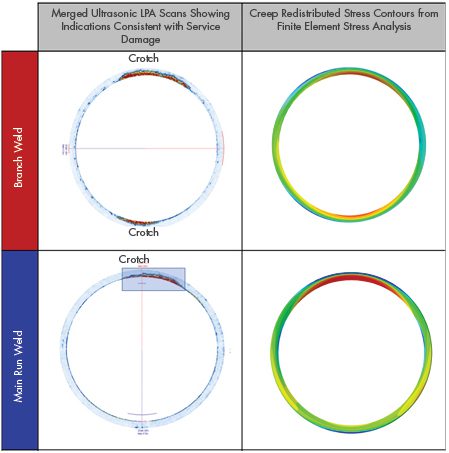
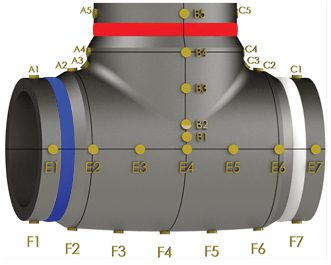
The digital twin paradigm offers promise in the energy industry where a DT is developed and maintained to identify changes in the system that helps detect anomalies, make maintenance decisions, or perform root cause analysis of failures. A finite element (FEM) model of a structure with a crack which is periodically updated with measurements of the crack dimension may be considered to be a DT of the structure whose purpose is to monitor crack propagation. One may scale up such models to larger structures, e.g., large components of energy systems such as gas turbines [8].
The application of DT technology to combined gas turbine, wind turbine, solar, and nuclear power plants are expected to increase in the years ahead with several application areas in the nuclear industry [9]. These include design, licensing, plant construction, training simulators, autonomous operation and control, failure and degradation prediction, physical protection modeling and simulation, and safety/reliability analyses [10].
SI’s expertise in FEM modeling, material degradation, and lifetime prediction models, together with the AIMS development team’s expertise in cyberinfrastructure, is well suited to building and maintaining a DT of an energy system or some other critical infrastructure and using the DT for preventive maintenance and other applications. DT is an evolving technology, and it may not be possible to fully automate the model updating process. Hence, the software as a service (SaaS) model may become the norm for DT products. SI is optimistic about the technical aspects of DT Technology and the opportunities to leverage these tools in supporting our clients.
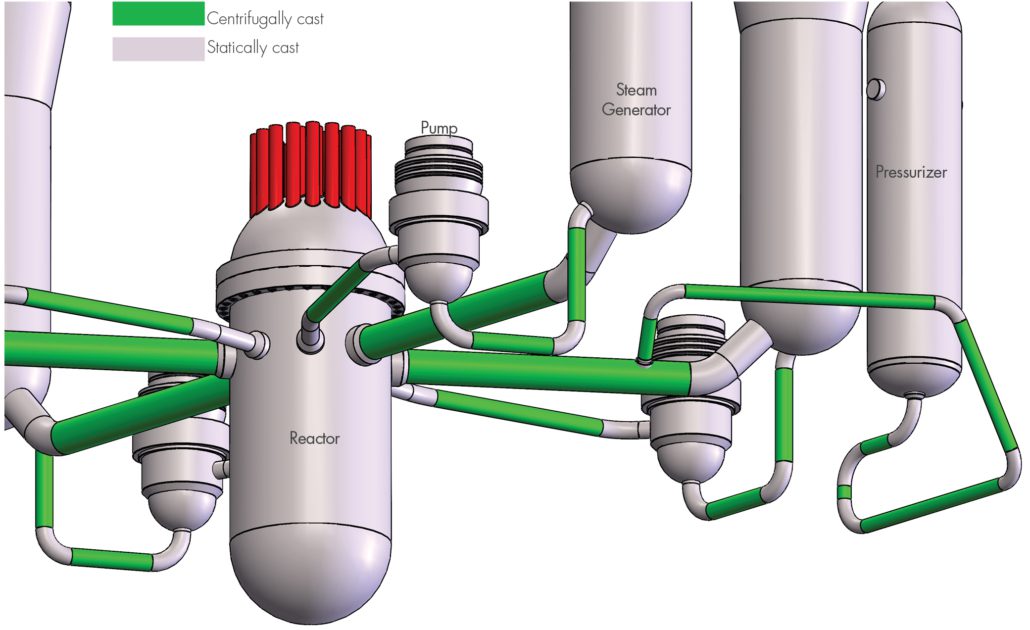
Figure 3. Digital twin concept for a nuclear power plant [10]
Power Gen Applications
With the emergence of Digital Twins in the power generation industry, our teams are able to use the synchronized digital representations of equipment to assist with early detection of potential failures, failure accommodation, optimized maintenance schedules, development of next-generation equipment, and workforce training.
Our staff are positioned to support digital twins’ development, coinciding with SI’s modeling expertise and highly capable AIMS platform cyberinfrastructure, cultivating the total package to handle any digital twins’ needs. The AIMS Digital Solutions platform is integral to our mission of providing the best-in-value, innovative, fully integrated asset lifecycle solutions. Digital products paired with our expertise in Engineering, inspections, and analytics help achieve a holistic asset management approach to our clients.
References
- S. Ferguson, Apollo 13: The First Digital Twin, April 14, 2020. Available at: https://blogs.sw.siemens.com/simcenter/apollo-13-the-first-digital-twin/
- B. D. Allen, Digital Twins and Living Models at NASA. Keynote presentation at ASME’s Digital Twin Summit, Langley, VA, November 3 2021 Available at: https://ntrs.nasa.gov/api/citations/20210023699/downloads/ASME%20Digital%20Twin%20Summit%20Keynote_final.pdf
- L. Wright and S. Davidson, “How to tell the difference between a model and a digital twin,” Adv. Model. and Simul. in Eng. Sci., 2020, 7:13.
- The Digital Twin, Ed. N. Crespi, A. T. Drobot and R. Minerva, Springer, 2023.
- ISO 23247-1: Automation Systems and Integration – Digital Twin Framework for Manufacturing – Part 1: Overview and general principles. International Organization for Standardization, Geneva, Switzerland, 2021.
- G. Shao, S. Frechette, and V. Srinivasan, An Analysis of the New ISO 23247 Series of Standards on Digital Twin Framework for Manufacturing, Proc. of the ASME 2023 Manuf. Sci. Eng. Conf., MSEC2023, June 12-16, 2023, New Brunswick, NJ, USA.
- M. Adams, et al., “Hybrid Digital Twins: A Primer on Combining Physics-Based and Data Analytics Approaches,” in IEEE Software, vol. 39, no. 2, pp. 47-52, March-April 2022.
- D. de Roover, Possibilities and Challenges in Developing a Digital Twin for Rapid Thermal Processing (RTP), APCSM Conference, Toronto, Canada, 2024.
- N. V. Zorchenko, et al., Technologies Used by General Electric to Create Digital Twins for Energy Industry. Power Technol. Eng., 58, 521–526, 2024.
- U.S. NRC, Digital Twins. Available at: https://www.nrc.gov/reactors/power/digital-twins.html#reports
 The guidelines within the NUREG documents apply to:
 Deploying any robotics in tanks is a challenging endeavor, with many practical factors that affect the ease and success of implementation. Several of these factors include: