CHARLOTTE, NC – SI Solutions is pleased to announce the purchase of SC Solutions, Inc., a respected provider of innovative engineering solutions for the advanced process controls and structural engineering industries. Founded in 1987, SC Solutions has served its clients in Silicon Valley and beyond, expanding to Sacramento, CA, Portland, OR, and Atlanta, GA.
SI Solutions, a privately held company, is a leading provider of mission-critical engineering, construction, testing, and maintenance services to the energy, process, and infrastructure markets. SI Solutions has over 500 employees and ten offices serving customers across the U.S. and internationally. SI’s capabilities span multiple technical disciplines, with a focus on specialized engineering, instrumentation, electrical design and construction, and advanced nondestructive examination.
SC Solutions, Inc. (SC), based in Sunnyvale, CA, specializes in structural engineering and advanced process controls. SC’s structural division has over 35 years of experience with numerical analysis of complex infrastructure assets, including those subjected to extreme loads and events such as earthquakes, dynamic impact, thermal shock, construction transients, and soil-structure-fluid interaction effects. SC’s controls engineering team has extensive experience in control design, modeling of physical systems, real-time software, signal processing, optimization, system identification, and fault diagnostics for the semiconductor, advanced materials manufacturing, energy, infrastructure, and defense industries.
Mark W. Marano, President and CEO of SI Solutions, stated: “Adding SC Solutions to our existing platform will bolster our Critical Infrastructure division, enhancing our ability to serve clients’ needs through new technical capabilities and expanded engineering offerings. SC Solutions’ highly respected process controls division will add a new market segment and a third reputable brand under the SI Solutions umbrella, diversifying our service offerings worldwide.”
Greg Loy, Chairman and co-founder of SC Solutions noted, “I’m proud of our team for the business we’ve built over the years; this is the next step in the company’s evolution. The additional investment from new ownership will allow us to further develop the products and services our clients have come to rely upon.”
Chris Martin, Managing Director of Jumana Capital and Chairman of SI Solutions, remarked, “The addition of SC Solutions to our family of brands grows the strength and capabilities of SI Solutions to meet the growing need for asset management, regulatory compliance, maintenance and upgrades within nuclear power, power services, process industries, pipeline integrity, critical structures, and controls engineering sectors in the United States and abroad. We are excited about the future for SI Solutions as we continue to build toward an extraordinary future.”
https://www.structint.com/wp-content/uploads/2024/01/SC-Solutions-News-copy.jpg363668Structural Integrityhttps://www.structint.com/wp-content/uploads/2023/05/logo-name-4-930x191-1.pngStructural Integrity2024-01-04 18:42:312024-01-04 18:42:31SI Solutions Expands Structural Engineering Expertise and Adds Controls Engineering Division with the Acquisition of SC Solutions, Inc.
A CASE STUDY FROM THE FERMILAB LONG BASELINE FACILITY
By: Keith Kubischta and Andy Coughlin, PE, SE
REFRESHER OF PART 1
From part one of the article (see News and Views Volume 51), we looked at the performance of a unique tubular mass concrete structure – the decay region of Fermilab’s Long Baseline Neutrino Facility – under complex thermal loading and thermal expansion. In the process of colliding subatomic particles in an accelerator and beaming them across the country underground, the facility contends with a massive amount of heat, an active nitrogen cooling system to remove energy, and shielding necessary for the surrounding environment. As we discussed in Part 1, Structural Integrity assisted with the design of the concrete structure by calculating the pertinent structural and thermal behavior under normal operation. Now for Part 2, we focus on forecasting the future life of the structure using advanced capabilities in analysis and delve into the actual life of this concrete structure while considering the construction process, a 30 year planned cycle of life, and how these influence planning for structural monitoring systems. In doing so, we attempt to answer a larger question: What can we learn from this structure that could be applied to other past and future structures?
These methods are not only applicable to new structures.Armed with the knowledge we can gain from record drawings, visual inspection, and non-destructive examination, SI is able to predict the life of concrete structures, new and old, giving key insights into their behavior in the future.
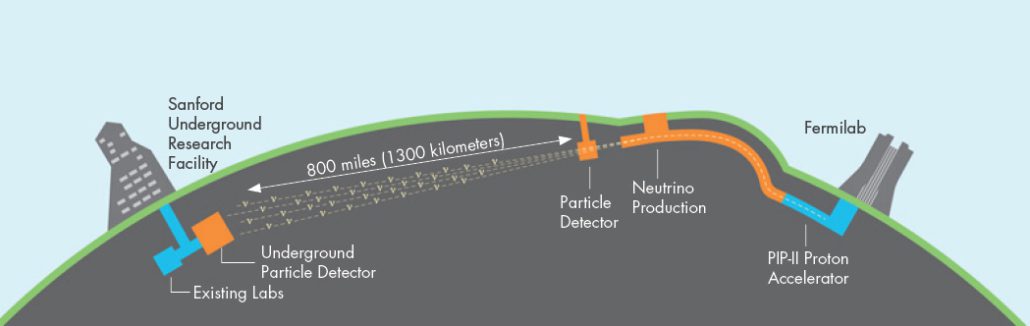
Figure 1. Fermilab Long Baseline Neutrino Facility (source https://mod.fnal.gov/mod/stillphotos/2019/0000/19-0078-02.jpg)
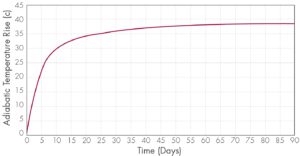
Figure 2. Adiabatic Temperature Rise for Concrete Placement
HEAT OF HYDRATION In understanding the life of a structure, we must first start at the beginning as the concrete is first poured where another heat transfer takes place. Contrary to popular belief, concrete does not “dry”, rather it “bakes” itself during the curing process. As concrete is poured, it begins heating up internally through an exothermic hydration reaction between water and cement. The effect of the heat of hydration can usually be ignored in typical thin-walled structures. In larger mass concrete structures, however, the heat generation can cause significant degradation and built-in damage that can affect the structural performance throughout the entire life of the facility.
A secondary subroutine as part of the ANACAP models is used for heat of hydration specific for construction analysis to convert the temperature rise into volumetric heat generation rate for thermal analysis. When heat is trapped deep inside the structure and can’t escape, the concrete exhibits a temperature rise similar to the curve in Figure 2, which is a function of the concrete mix proportions.
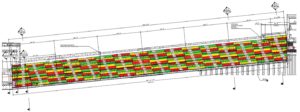
Figure 3. Placement Sequence of 164 Concrete Pours
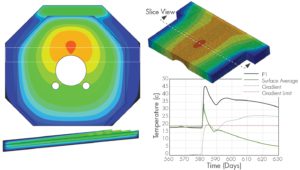
CONSTRUCTION ASSESSMENTS For the operating conditions covered in Part 1, the coupled 3D thermal stress analyses performed on this project were thermal conduction steady-state analyses. Construction of such a large concrete structure is subjected to additional requirements, and a Nonlinear Incremental Structural Analysis (NISA) was performed to evaluate the structure under the construction loadings. Herein, the thermal analysis during the concrete placement sequence requires a transient numerical solution methodology. This thermal analysis was used to monitor additional requirements for temperature during concrete placement, and a mechanical NISA study monitored the movement of the central cooling annulus vessel. The complete NISA coupled thermal-stress analysis simulated the entire construction phase over the period of a year and a half of the planned construction schedule. To accomplish this, the model was segmented into 164 concrete pours, each one activated (turned on) within the model on a specific day outlined in a construction schedule, as shown in Figure 3. As the concrete is poured on its specific day, the heat of hydration begins to heat up the internals of the concrete, the outside ambient temperature pulls the heat away from the concrete, and formwork insulates the heat transfer temporarily before being removed. As each new concrete segment is poured (activated in the simulation) it begins a new heat cycle, shedding heat into surrounding segments, changing surfaces that are exposed to air, or where the formwork is located. Upon completion of the thermal NISA study, Structural Integrity could advise on peak temperatures of each pour (Figure 4), compare internal to external temperatures and make optimal recommendations for insulation to keep the concrete from cooling too fast.
Figure 4. Thermal Views and Monitoring of Concrete Placement Temperatures
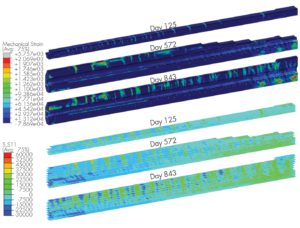
With the thermal NISA study completed, we then coupled the thermal with the mechanical stress analysis following a similar procedure. The model was broken up into the same 164 segments, with the reinforcement separated into individual segments. As a segment was poured, its weight was first applied as pressure on surrounding segments before the segment cured enough and took load. Formwork was considered a temporary boundary condition (simulated with stiff springs): activated then removed when appropriate. The concrete internal reinforcement was activated with each concrete segment. The cycles continue with each additional segment added. The concrete material for each segment had its own values for aging, creep, shrinkage, and thermal degradation for when the concrete was placed. The effect of creep and shrinkage could be significantly different for concrete poured on the first day and concrete that is poured a year later.Mechanical tensile strain, a proxy for cracking, was plotted as shown in Figure 5.
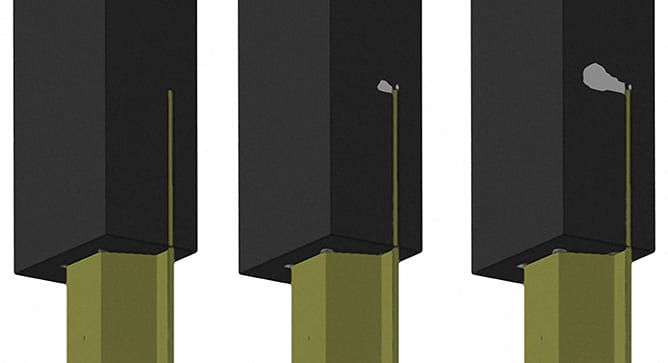
A critical issue of concern was the steel annulus structure at the center of the concrete tunnel. The entire steel structure was placed prior to concrete being poured around it. The steel structure was affected by the thermal and mechanical loads of each concrete pour. Structural Integrity showed this structure “breathing” as thermal/mechanical loads pass from each concrete pour into the steel structure. Armed with a complete picture from the NISA stress analysis, Structural Integrity could show the animation of annulus movement, check the out-of-roundness, and advise on reinforcement placement.
Figure 5. Concrete Mechanical Strain (i.e., Cracking) and Rebar Stress During NISA Construction
LIFECYCLE ASSESSMENTS During the design phase, reinforced concrete structures are typically designed for a bounding range of expected loads, to include thermal load cycles, periodic live load variations, and/or vibration from mechanical equipment. Up to this point, the design phase analysis started from a “pristine” uncracked structure and applied the expected load with the beam and cooling at full power. Seldom is the cumulative impact of cyclic loading considered for the expected service life of the structure. Structural Integrity, having performed the NISA study, now had significantly more accurate state of the structure with expected cumulative damage already built-up. This gave us the unique opportunity to extend the analysis from the current state through the lifecycle of the structure, comparing the “pristine” to the “cumulative” case.
The expected life of the structure is 30 years of operations with the beam running for no more than nine months a year and three months off. These cycles are grouped together in either seven- or five-year blocks with a rest period of two years for maintenance or upgrades in between. The experiment starts small, ramping up the power to half the total output for the initial seven years. For the lifecycle assessment, time is still a critical element, not just for properties of concrete affected by time but the physical computational time. The transient thermal analysis would be too time intensive to run over the 30 years of life that we want to observe. To simulate the thermal cycles, the beam steady-state thermal response was calculated at each peak power level. This provided different thermal states of power, which the mechanical analysis could switch on or off as needed and interpolate between them to give a simulated ramp of power. The computational time could then be utilized on the mechanical stress lifecycle assessment.
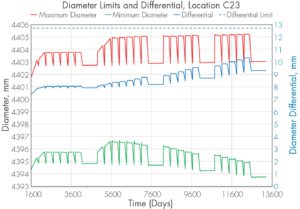
Figure 6. Out-of-Roundness Check through Lifecycle, Ratcheting Effect of Power Cycles
With the completion of the lifecycles analysis, Structural Integrity could once again provide valuable information to the researchers and designers: deformations of the entire structure, deformations of the annulus, out-of-roundness of the annulus (Figure 6), estimates of crack width, etc.
Most importantly, we can answer and show comparisons between the designed load from a “pristine” model analysis to those from the “cumulative” analysis.
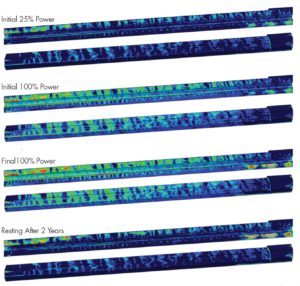
Even prior to the lifecycle assessment, the cumulative damage at the end of the NISA study signaled different behavior in the expected cracking (Figure 7). From the construction process, the concrete showed cracking near the boundaries between each concrete pour. These developed due to the natural thermal cycling of the construction process. The lifecycle thermal loading continued to push and pull the structure adding to the already existing cracks. Previously, the boundary point between the fixed rail and sliding rail section concentrated the thermal loading to induce significant cracking. Now the stress will be more evenly distributed throughout the upstream section. The cracking during construction provided natural thermal breaks along the whole length of the structure.
Figure 7. Concrete Strains at Various Point in Structures Lifecycle
HEAT DISPERSAL
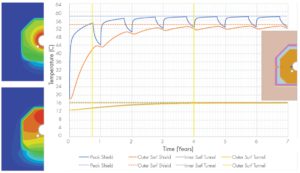
SI then turned toward an additional question, where does all this excess heat go as the beam is cycling power? The shielding concrete is still heating up to over 60 degrees Celsius at the exposed surfaces. The air around the shielding concrete is trapped by the decay tunnel and venting conditions are unknown. We would need to produce a calculation based on the transfer of heat from the shielding concrete to the surrounding air/access tunnel, to the decay tunnel itself, and then the surrounding soil. Assuming the worst-case scenario, a point was selected along the length of the tunnel that produces maximum temperatures in the concrete. The cross section at this point is turned into a 2D model for use in a thermal analysis conducted as steady-state and transient to explore the heat transfer into the surrounding sections. A temperature profile of the decay tunnel wall was used to check its design from the thermal gradients, shown in Figure 9. The temperature of the air space between the structures can be monitored help in planning for when the tunnel can safely be accessed.
ONLINE MONITORING Engineers at SI are always eager to add data to our models.As this structure is constructed and put into service, the actual construction and startup sequence is likely to change, allowing for the model to be rerun and the lifecycle projection recalculated.Furthermore, data from temperature sensors and crack monitoring gauges could potentially help calibrate the model based on observed conditions to improve the accuracy of our projections moving forward.This methodology is applicable today to existing aging concrete structures where the lifecycle projection can be calibrated to existing observed conditions and data from online monitoring and non-destructive examinations.
Figure 8. Crack Width Estimation Based on Reinforcement Strain
CONCLUSIONS Structural Integrity successfully developed expanded capabilities to model thermodynamics for the energy deposition and nitrogen cooling system. SI pushed the capabilities of our concrete model to capture over 30 years of construction and operations. Along the way, SI showed that our advanced modeling, combined with our advanced concrete model, positively influenced the design of the structure, and heavily supported the design and research teams with valuable information. The robustness of the calculation showed that SI is the present and future of concrete structure analysis.
SI demonstrated that our advanced modeling, combined with our advanced concrete model, positively influenced the design of this structure and heavily supported both the research and design teams with valuable information.
Figure 9. 2D Thermal Results of Decay Tunnel, Air Access Space, Shield Tunnel Walls, and Surrounding Soil
https://www.structint.com/wp-content/uploads/2023/01/News-Views-Volume-52-Forecasting-the-Life-of-a-Mass-Concrete-Structure-Part-Two.jpg363668Structural Integrityhttps://www.structint.com/wp-content/uploads/2023/05/logo-name-4-930x191-1.pngStructural Integrity2023-06-28 16:13:152023-06-29 15:35:19News & Views, Volume 52 | Forecasting the Life of a Mass Concrete Structure, Part Two
A CASE STUDY FROM THE FERMILAB LONG BASELINE FACILITY
By: Keith Kubischta and Andy Coughlin, PE, SE
All around us is aging concrete infrastructure. From the dams holding back water, to the nuclear power plants creating carbon free electricity, to the foundations of our homes and offices. Though many advances have been made in the design of concrete structures, how do we know these structures will stand the test of time. Can we see the future of a concrete structure? Can we know the damage built into a structure during construction, normal life, and extreme events?
Answer:Yes we can.
Background
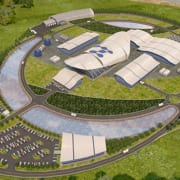
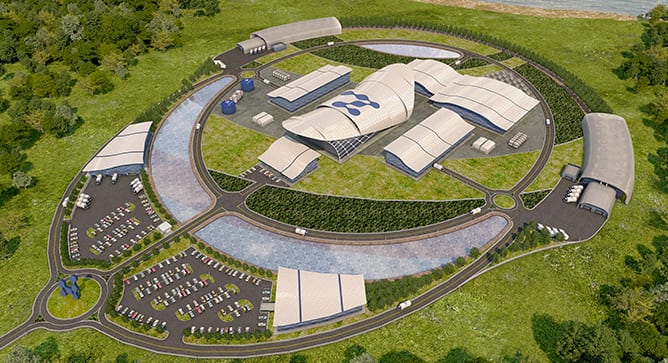
In Batavia, Illinois a facility being built that is the first of its kind in the world. Fermilab’s Long Baseline Neutrino Facility will accelerate protons using electromagnets up to incredible speeds in a particle accelerator. After traveling through the campus, the particles are redirected to a graphite target where the collision breaks them into their component particles: pions and muons. These components decay and are segregated off. What is left is believed to be the building blocks of the universe: neutrinos, which can pass undisturbed through matter. A beam of neutrinos passes through near detectors and travels over 800 miles underground to a detection facility in an old mineshaft at Sanford Underground Research Facility in South Dakota, a facility that can also detect neutrinos hitting the earth from exploding stars.
Figure 1. Fermilab Long Baseline Neutrino Facility (source https://mod.fnal.gov/mod/stillphotos/2019/0000/19-0078-02.jpg)
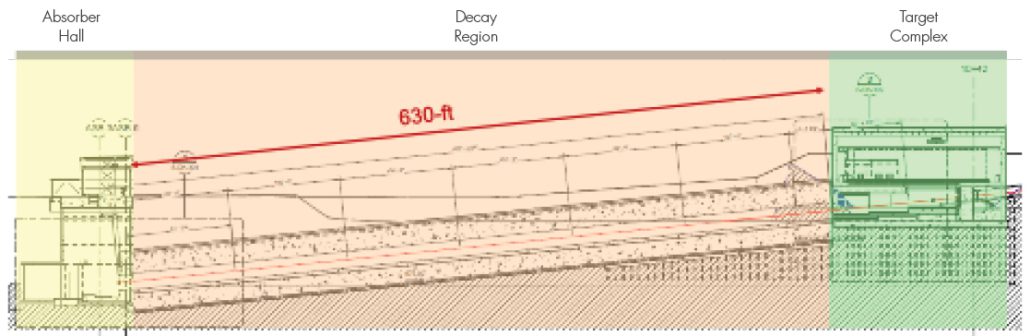
After the graphite collision what is left behind has the potential to create some harmful biproducts such as tritium, or hydrogen-3, which needs to be kept out of the surrounding atmosphere, soil, and ground water. This occurs in the decay region slightly downstream from the target complex, which is 630-ft long concrete tunnel with 18 feet of concrete surrounding the beam line. Exiting the decay tunnel any leftover particles are absorbed downstream in the absorber hall.
Figure 2. Overview of Decay Region
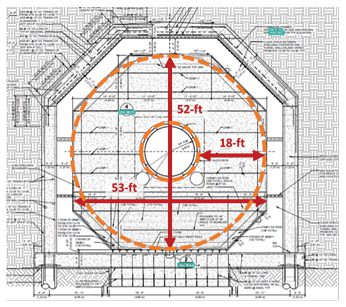
The tunnel of the decay region houses an octagonal shielding concrete structure to provide shielding for the byproducts. This octagonal structure is over fifty feet tall and wide with 42,000 cubic yards of concrete, enough concrete to construct a baseball stadium. At the center of the tunnel is a double walled stainless steel pressure vessel charged with helium on the inside and a chilled flow of nitrogen gas within the annulus. The octagonal shielding concrete structure is surrounded by an access area to inspect the structure, the outer decay tunnel walls, and the surrounding soil.
Figure 3. Typical Decay Region Tunnel Cross Section
The octagonal shape of the shielding concrete was not always so octagonal. Starting off with small steps, Structural Integrity demonstrated advanced capabilities to model thermal structural behavior of mass concrete, while developing and expanding on existing capabilities. SI’s positive impact on the early stages of the project earned us a larger role where we displayed additional capabilities to positively influence the design of the structure.
SI followed the design progression and answered some critical questions, such as:
Will the decay region be within acceptable temperatures when subject to the extreme energy deposition from the decaying particles?
What thermal expansion joints will be required to prevent cracking, and movement of the underground structures in a harmful way?
How can we best optimize the reinforcement of such a massive structure?
SI answered these questions and more through expert analysis, expanding our capabilities through proprietary simulation ranging from earlier design concepts, construction stages, and up to including a 50-year design life of the structure.
Part One of this article will look at the influence our work had of the design of the massive structure and the benefits of “seeing the cracks” before they happen.
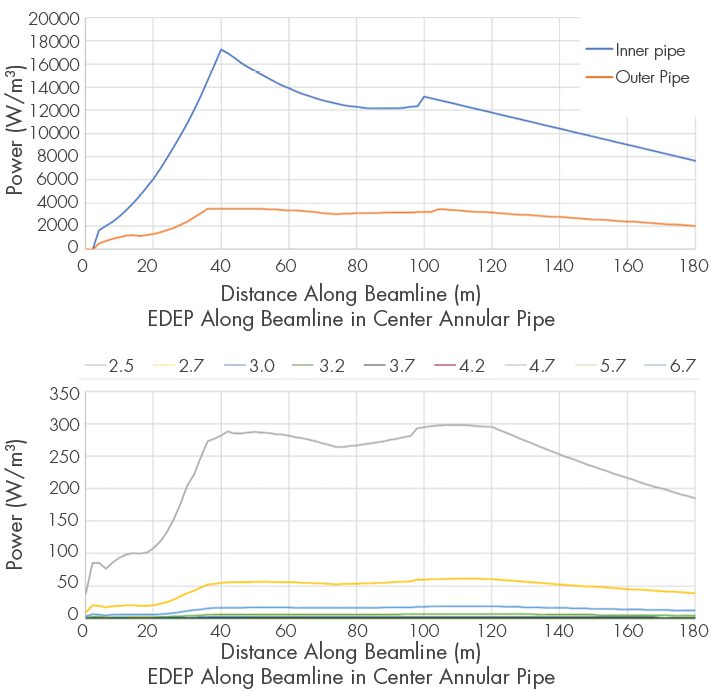
Figure 4. EDEP Axial and Radial Distribution along the Beamline
Energy Deposition and Cooling Thermodynamics
Concrete that gets too hot can vaporize the pore water and even break apart. The transfer of heat in concrete is a critical component of the analysis and is both added to the structure and removed. Thermal loading was provided by Fermilab in the form of volumetric energy deposition (EDEP) on the concrete and steel based on particle physics software simulation program MARS. The distribution of EDEP varies both radial outward from the beamline and compounded by its positioning along the length of the tunnel. SI would need to convert the distribution into a subroutine of distributed flux for use by the analysis program. The distribution was first translated for use in 2D analysis, expanded into 3D space, and then rotated in coordinate space to account for the slope of the beamline. With the EDEP adding heat to the system, chilled nitrogen is needed to remove heat.
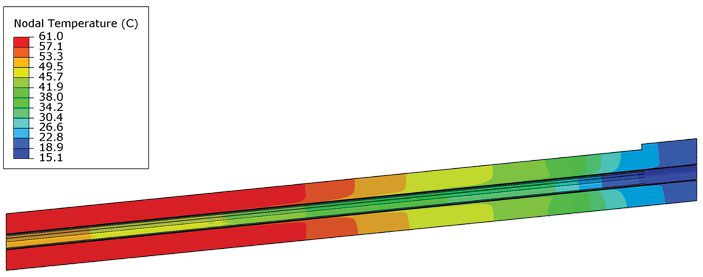
Figure 5. Accurate Thermal Distribution along the Decay Tunnel Shielding Concrete Structure.
A bit of “back-to-school” was needed to solve the thermodynamic problem. The heat transfer coefficient and temperatures of the nitrogen gas cooling system were calculated using classical methods on convection relationships in annular spaces. With the known EDEP into the concrete and steel, which dominates in regions closer to the center, it was decided as a design condition that all heat be taken by the nitrogen to obtain the outflow temperature of the nitrogen gas. The nitrogen temperature was calculated in 10m increments along the annular pressure vessel and at outflow based on an energy balance equation. The heat transfer coefficient was calculated using three different empirical relationships for Nusselt number utilizing the lower bound conservative estimate in the analysis. Our efforts created an accurate model in 3D space of the heat transfer into the shielding concrete. As a result of the nitrogen cooling system, we were able to keep concrete temperatures below the limit of 110 degrees Celsius. With the thermodynamic problem solved, SI progressed, coupling the solution to the mechanical stress model.
Concrete Capabilities
If there is one thing concrete is guaranteed to do, it is to crack. SI’s proprietary concrete constitutive model, ANACAP, is designed to predict concrete cracking and preform under various states of those cracks opening and closing. The behavior of concrete is highly nonlinear with low tensile strength, shear stiffness and strength that depend on crack widths, and plasticity compression. The main components of the concrete model utilized in the design phase analyses are tensile cracking, post-cracking shear performance, and compressive yielding when the compressive strength is reached. The use of the ANACAP concrete model has been validated and verified through 30 years of use and a key component for the nonlinear assessments.
Figure 6. Stepped vs Octagonal Cross Section, Thermal Distributions and Concrete Strain (Cracking)
Influence on Design
Accurate modeling of thermodynamics / thermal analysis, coupling with the mechanical model / stress analysis, and the capabilities of the nonlinear constitutive concrete model allow for the simulation of a full 3D model of the shielding concrete under full power operations. The design team sought to minimize the cracking of the structure, monitor elongations and other movements affecting the beam line, and design connections at the structure boundaries. SI coordinated with research and design teams to facilitate several cross-section iterations with different shapes and layers of shielding. Each design iteration was analyzed to demonstrate the benefits or consequences. An early iteration of the shield concrete cross-section was a stepped block shape. The corners of the stepped cross-section displayed the potential for cracking. SI addressed this potential design trait through influencing the development of the octagonal section shape. This optimization allows the design to minimize the amount of reinforcement needed to control cracking.
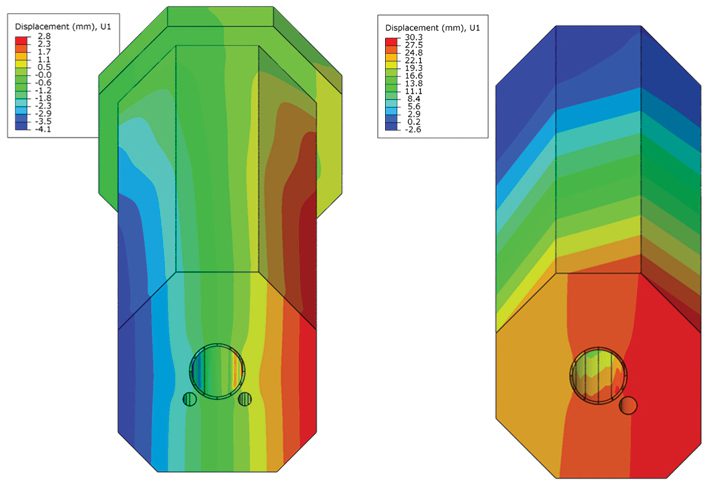
Figure 7. Lateral Displacements of Single Return Pipe and Dual Return Pipe
In addition to the cooling annulus at the center of the structure, there are the return ducts for the system to bring the nitrogen back to the target complex facility. The design initially used four return pipes spread out at four different corners. In one iteration the design team attempted to reduce the four return ducts to one larger return pipe to reduce the concrete volume required for shielding. The design iteration with one return duct was attempting to reduce costs by reducing the overall amount of concrete needed. Our calculations quickly identified unintended consequences. The asymmetrical shape was creating displacements along the transverse horizontal direction, pushing the beam alignment off-center by over an inch (~30 mm). The shape was quickly updated to be symmetric with two return pipes.
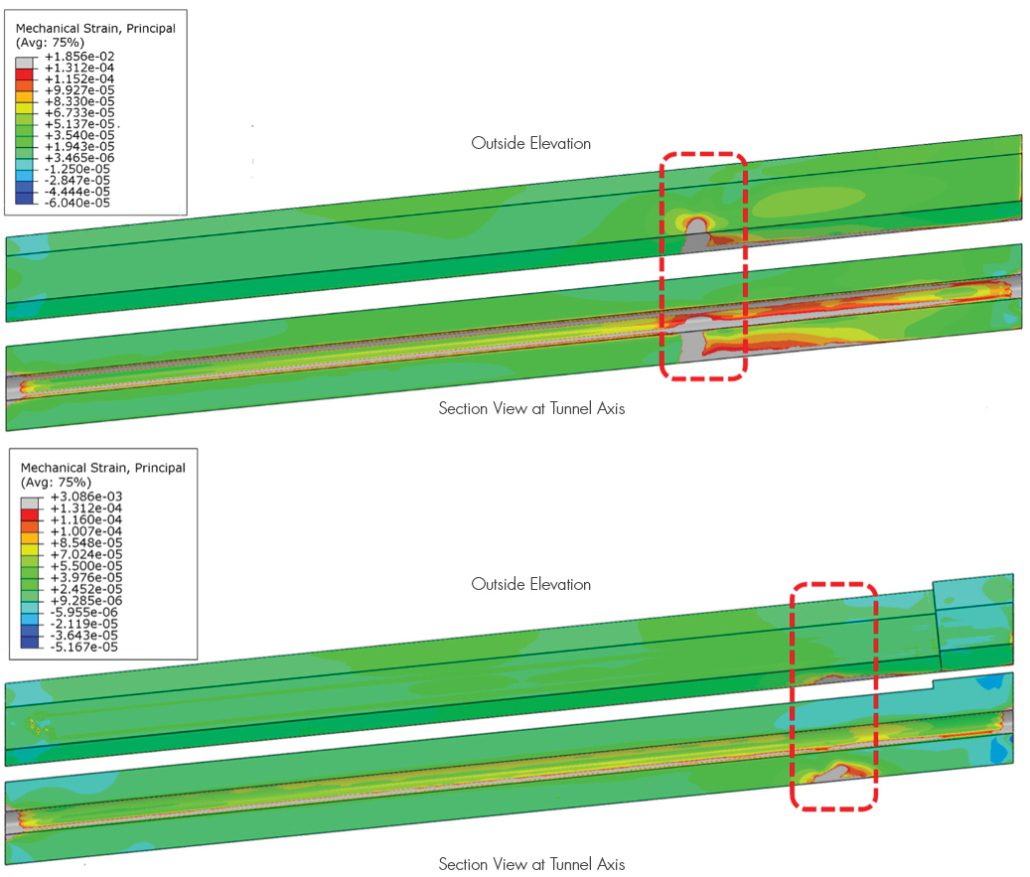
From room temperature to 60 degrees Celsius, concrete is going to expand. Traditional thermal breaks cannot be utilized in this structure to maintain continuity and provide shielding. The design needed to allow the structure to expand at the downstream end. Most of the structure is supported by rails where it was designed to freely slide at the bottom of the octagonal section during the expansion phase. A section of these rails needs to be fixed at the upstream end where it was designed to resist the gravity of the structure along the slope. SI provided valuable design influence with where the fixed rails were to be positioned as the thermal loading created immense stress at the location between the fixed boundary and sliding boundary. In the original position, SI’s calculations identified a concentrated area of cracking. To minimize the amount of cracking and additional reinforcement needed, SI proposed moving the position of restraint towards the cool / upstream end of the tunnel.
Figure 8. Effect of Fixed Rail Boundary Condition Position on Strain.
How do you stop 42,000 cubic yards of concrete from expanding?
Answer:You Don’t.
Conclusions
Structural Integrity successfully developed expanded capabilities to model thermodynamics for the energy deposition and nitrogen cooling system. SI used the capabilities of our concrete model to influence the structural design by “seeing the cracks” before they happen, making design adjustments, and reducing reliance on additional reinforcement. SI was able to give key insights for the concrete structure and potential cost savings through optimization.
Part Two of this article will look at the life of the structure form the day concrete is first poured to 30 years of power cycles. Delving into the future to see this structures test of time and monitoring methods to see if our predictions come true.
https://www.structint.com/wp-content/uploads/2022/04/Structural-Integrity-Associates-News-and-Views-Volume-51-Managing-Forecasting-the-Life-of-a-Mass-Concrete-Structure.jpg363668Structural Integrityhttps://www.structint.com/wp-content/uploads/2023/05/logo-name-4-930x191-1.pngStructural Integrity2022-04-19 16:50:362024-01-09 13:33:05News & Views, Volume 51 | Forecasting the Life of a Mass Concrete Structure, Part One
Structural Integrity’s Own, Andy Coughlin published by American Society of Civil Engineers, ASCE
Andy Coughlin’s work has been published in the ASCE Structural Design for Physical Security: State of the Practice. The Task Committee on Structural Design prepared the publication for Physical Security of the Blast, Shock, and Impact Committee of the Dynamic Effects Technical Administration Committee of the Structural Engineering Institute of ASCE. Andy wrote Chapter 10 on Testing and Certification for Physical Security and assisted on several other chapters.
Structural Design for Physical Security, MOP 142, provides an overview of the typical design considerations encountered in new construction and renovation of facilities for physical security. The constant change in threat tactics and types has led to the need for physical security designs that account for these new considerations and anticipate the environment of the future, with flexibility and adaptability being priorities. This Manual of Practice serves as a replacement for the 1999 technical report Structural Design for Physical Security: State of the Practice and is intended to provide a roadmap for designers and engineers involved in physical security. It contains references to other books, standards, and research.
Topics include
Threat determination and available assessment and criteria documents,
Methods by which structural loadings are derived for the determined threats,
Function and selection of structural systems,
Design of structural components,
Function and selection of window and facade components,
Specific considerations for retrofitting structures,
Testing methodologies, and
Bridge security.
This book will be a valuable resource to structural engineers and design professionals involved with projects that have physical security concerns related to explosive, ballistic, forced entry, and hostile vehicle threats.
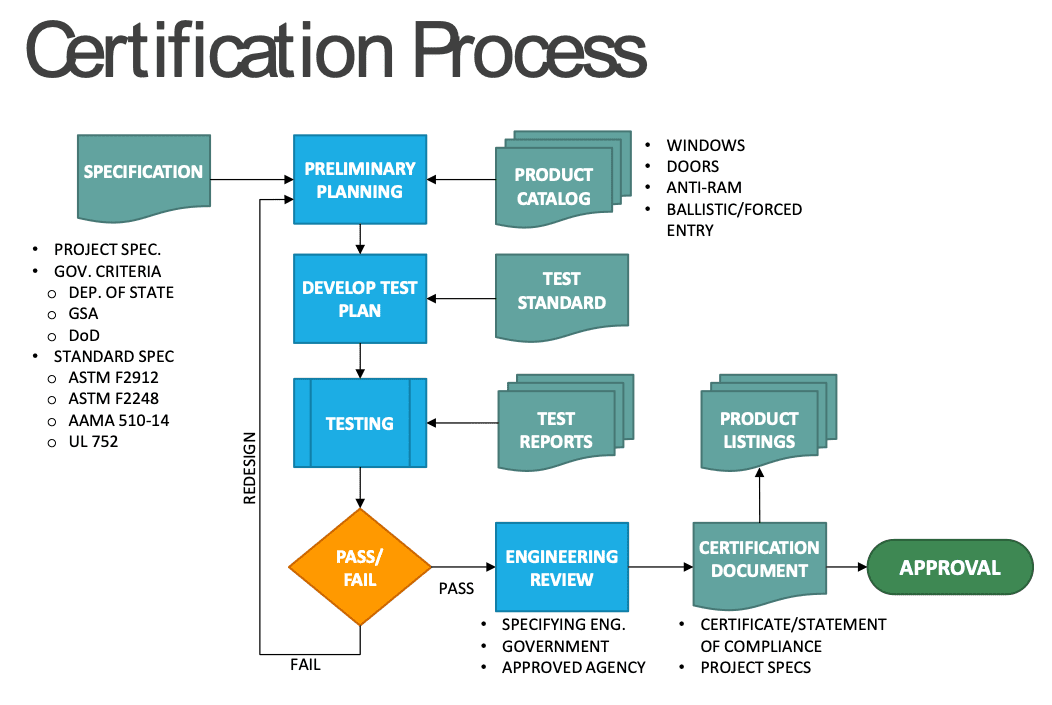
Of particular note is the publication of the process by which products can be tested and certified to achieve physical security performance in blast, ballistics, forced entry, and vehicle impact. Often unclear or overly specific requirements hamper the application of quality products which protect people and assets from attack. The certification process below shows how approved agencies, like SI’s TRU Compliance, play a role in testing, evaluating, and selecting products for use in critical physical security applications, rather than relying solely on the claims of the manufacturers. TRU’s certification program is the first of its kind to receive IAS Accreditation for the certification of physical security products.
https://www.structint.com/wp-content/uploads/2021/08/American-Society-of-Civil-Engineers-ASCE-Featured-Image.jpg363668Structural Integrityhttps://www.structint.com/wp-content/uploads/2023/05/logo-name-4-930x191-1.pngStructural Integrity2021-08-13 14:38:512021-10-04 18:09:26Structural Design for Physical Security
By analytically simulating the steps in the construction process, including the sequence of concrete placements, and tracking the history of the material behavior starting from initial placement, the potential for cracking is evaluated by comparing the time dependent stress and strains to the concrete cracking resistance and capacity.
Aging Infrastructure Issues
The infrastructure in the United States is aging and, whether publicly or privately owned, significant resources are required to repair, replace, or modernize it.Due to the high costs associated with these efforts, owners need to identify structures with high risk-of-failure consequences and find the most cost-effective solutions for rehabilitation.High consequence infrastructure includes:
Highway and railway bridges,
Roadways for intra and interstate transportation,
Dams, locks, and levees for flood control and cargo transportation,
High rise business, apartment, and condominium towers, and
Power generation and distribution facilities for Nuclear, Fossil and Hydro utilities.
All infrastructure, is susceptible to degradation that comes with aging.The accumulation of degradation, and a structures subsequent failure, is difficult to predict due to the numerous real-world factors that influence rates of degradation.These real-world factors can lead to some structures failing prematurely and others lasting well beyond their original design life.Asset owners need to be on the lookout for:
A structure that is nearing or has exceeded its expected design life,
A structure that shows signs of steel corrosion, freeze-thaw damage, or concrete degradation such as alkali aggregate reaction (AAR),
A structure that is overloaded due to an increase in auto, truck or rail traffic,
A structure with a known design deficiency when evaluated with modern design code requirements,
Increases in regional hazards, such as increased seismicity or increased probable maximum flood levels, and other climate change related issues.
Often, structures are kept in servicebeyond their original design life.Many older structures are held to a design basis, i.e. code requirements, consistent with the time the structure was designed. Evaluating older structures using current code requirements can potentially affect original safety margins both positively and negatively. Increased capacity limits can be established for steel welded and bolted connections and utilizing actual concrete compressive strengths above original design strength that may provide added safety margin. On the other hand, identifying substandard details relative to current practice, particularly concrete reinforcement detailing will reduce originally considered safety margins. Additional factors that can affect the service life of a large infrastructure projects include environmental conditions, reliability of materials, quality of construction, and loading conditions.
Throughout the country, many structures such as bridges, dams, and power generating facilities remain in active service as they approach or exceed their design (or licensed) service life. Replacement is often prohibitive for many of these structures due to cost. However, failure of these structures could have more significant consequences beyond lost revenue, including loss of life.Identifying structural vulnerabilities and designing retrofit modifications is essential to economically extending the service life of these structures.
Current Regulations
There is no single agency that oversees the various types of infrastructure within the United States. The following structures generally fall under the purview of these agencies:
Bridges, Roadways and Railways – National Transportation Safety Board, Federal Highway Administration, State Level Departments of Transportation, and some local City Departments of Transportation
Nuclear Facilities – Nuclear Regulatory Commission (NRC), US Department of Energy
High Rise Buildings – State and Local City Building Departments
Dams for Hydroelectric and Water Storage – Federal Energy Regulatory Commission (FERC), State Level Dam Safety Departments
At a high level the different regulatory bodies have a common mission to keep asset owners accountable to maintaining the mandated level of safety for the general public. Different regulations and procedures are required depending on the type of project, owner, and overseeing agency involved.
Lifecycle of a Structure
As structures reach the end of their design service lives or are in extended service, regulators typically require asset owners to demonstrate that these structures can still maintain their functionality while posing a low risk to the public safety, regardless of expense to the owner. Thus, it is beneficial for the owner to perform maintenance to ensure safe and functional assets that are profit positive, versus the potentially large costs incurred during decommissioning, removal and remediation of project sites.
Lifecycle structural health monitoring and simulation is a methodology to track changes in a structure that occur during the structures service life. Monitoring can be performed through non-destructive examination techniques. Continuous health monitoring helps owners maintain their assets by providing a warning if a sudden change or degradation accumulation is observed.This data can feed desktop simulations which incorporate the time variable into the modeling of the asset, giving point-in-time snapshots of how the structure behaves under loading during different stages of its life.
Predicting Degradation: During Design
During the design phase, large infrastructure projects are designed for a variety of expected loads including thermal load cycles, live loads,and operational loads. Seldom is the cumulative impact of cyclic loading considered when estimating the expected service life of the structure. Incorporating transient seismic demands or some other unexpected blast, shock or impact loading in combination with the expected stress range that occurs in structural components the lifecycle endurance limit can be evaluated that may be different from originally established design basis limits. For example, concrete degradation typically manifests itself as cracking, sometimes occurring in unexpected locations. Cracking can allow water infiltration, leading to internal corrosion of reinforcement and corrosive swelling, which can weaken the structure and accelerate degradation. In cold environments repeated freeze-thaw cycles will further damage the concrete.
Cumulative damage not only affects the loss of static strength, but will also change the dynamic characteristics of the structure. This can lead to the poor performance of a structure supporting vibrating equipment or a structure subjected to seismic loading. By incorporating the effects of damage accumulation in a structural assessment, the time-varying dynamic characteristics of the structure can be identified. Incorporating these effects as part of a lifecycle assessment can provide the owner with a more realistic understanding of actual structural condition of their asset that can guide targeted remediations (i.e. mitigate excess equipment vibration) or alert the owner to an increased risk of failure under a postulated seismic event.
Predicting Degradation: During Construction
During construction of mass concrete structures large temperatures develop due to concrete curing.A Nonlinear Incremental Segmental Analysis (NISA) evaluates the thermal and static loading of young concrete to determine the potential for cracking.The propensity for cracking depends on the concrete mix, environment, and boundary conditions imposed during construction.The concrete temperature varies with time and depends on the volume and rate of concrete placement, the sequence and geometry of the placements, the concrete placement temperature and heat generation rate, and the ambient conditions.The boundary conditions imposed during construction depend on the sequence and geometry of the placements, the interaction with the foundation/formwork and any adjacent or embedded structures, and the time dependent aging, creep, and shrinkage properties of the already placed concrete lifts.To accurately account for all of these factors, the NISA must be capable of representing a coupled thermal-mechanical analysis with nonlinear material properties.By analytically simulating the steps in the construction process, including the sequence of concrete placements, and tracking the history of the material behavior starting from initial placement, the potential for cracking is evaluated by comparing the time dependent stress and strains to the concrete cracking resistance and capacity.The cracking resistance is constant for any mature concrete present, such as pre-cast concrete forms, but is time dependent for the freshly placed young concrete since the tensile strength and modulus are changing as the concrete hardens and ages.
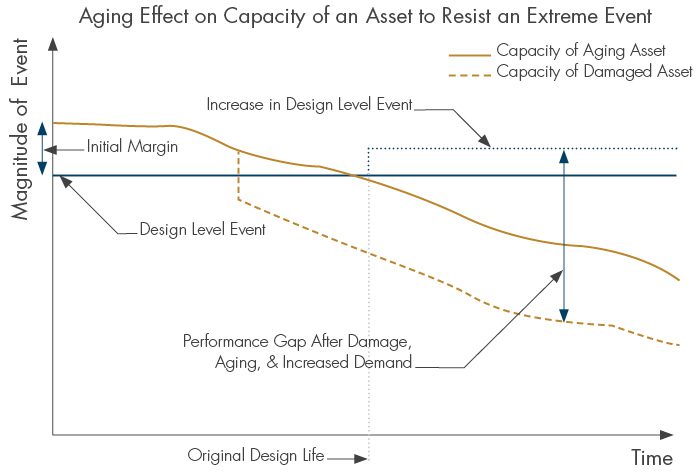
Figure 1. Aging Structures and Decreasing Margin of Safety
Predicting Degradation: During Service
A concrete structure often has predictable and repeating loading patterns over the course of its service life.For instance, a dam will reliably have high and low water levels throughout the year, though the actual levels may depend on the weather in a given year.A bridge will reliably experience different load patterns in weekday versus weekend traffic.A nuclear containment structure will experience thermal load cycles during power generation operation and shutdown for planned outages.
When looking into the future, engineers make reasonable predictions of different loading events during the initial design phase of a structure. Supplementing these prediction methods with sensor data and observed damage from onsite can help predict the time where the structure goes from safe to unsafe and remedial measures need to be taken. Sophisticated concrete material models, such as SI’s proprietary ANACAP model, can incorporate all known forms of time-based concrete behavior such as creep, shrinkage, radiological degradation, cement hydration, alkali aggregate reaction, steel corrosion, scour of concrete, and freeze-thaw cycles. This can further enhance the predicted structural performance during the design basis and extended license period of critical infrastructure as part of an asset owners risk management program.
Figure 2. Concrete arch dam circa 1909, aging degradation Issues subject to increased flood and seismic demands
Time-Dependent Margin
Figure 1 shows the capacity of a structure to resist a large event (such as a flood or earthquake), and how the margin of safety changes over time. Due to safety factors built into design codes, new structures have a minimum margin of safety against failure even when accounting for small design approximations and construction errors.That margin of safety can decrease when a transient event causes damage (e.g. an earthquake, ship impact, or large flood) and as the structure ages and degrades over time.Further reductions in margin can occur as hazards can increase over time, such as when flood events become more common or when new earthquake faults are discovered from geologic mapping.Over a structure’s service life, as it accumulates damage from both transient events and aging, the available margin may be much lower than what was originally intended, increasing the risk of catastrophic failure.
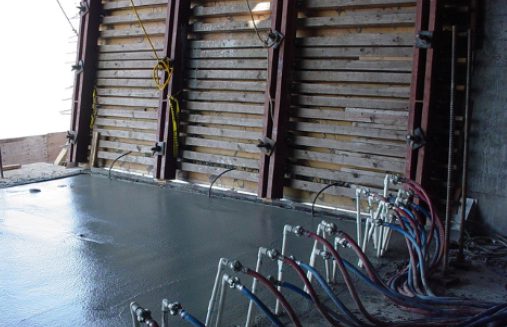
Figure 3. Concrete placement with active cooling to reduce concrete heat generation
Answering Tough Questions
Can an asset survive an earthquake or large flood event today? How big of an event can it survive? Can it survive the same event ten years from now?How does the structural performance change if we put a remedial measure into place?Without remediation, how long until the structure is unsafe? These questions can be answered with time-based structural lifecycle modeling.
Although much of the infrastructure in the USA is already functionally obsolete – or worse: at risk of catastrophic failure – much of it is effectively operating safely beyond its original design life.Finding assets with the highest risk allows owners to prioritize limited funding for rehabilitation and remediation.Lifecycle modeling helps answer those important questions when the key decisions need to be made.
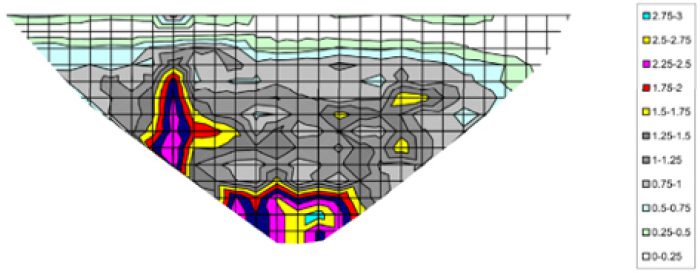
Figure 4. Example of Section Loss Contour using High Definition Scanning (HDS), Spectral Analysis of Surface Waves (SASW) and Acoustic Tomography (AT) Methods
By: Galen Reid and Katie Braman How does TRU or the public know the manufacturer is continuing to produce a product that complies with the certified construction and configuration without retesting periodically? Certification of products to withstand extreme event loading can open many opportunities for manufacturers to sell high value products when others have a […]
https://www.structint.com/wp-content/uploads/2021/06/News-View-Volume-48-Post-Seismic-Certification-What-Do-Manufacturers-Do-to-Keep-Their-Products-TRU-Listed.jpg363668Structural Integrityhttps://www.structint.com/wp-content/uploads/2023/05/logo-name-4-930x191-1.pngStructural Integrity2020-09-30 12:58:122021-07-22 16:44:26News & Views, Volume 48 | Post Seismic Certification: What Do Manufacturers Do to Keep Their Products TRU Listed?
The health facility is designed to fully separate patients from medical workers, protecting both parties and minimizing the PPE required to operate the suite.
COVID-19 has presented humanity with unprecedented challenges.As economies reopen, solutions are needed that allow businesses to operate while protecting the health, safety, and security of the general public.
In an effort to positively impact that change, Structural Integrity Associates (SI) is working with Parsons Corporation, a global technology leader, to design a self-contained, mobile health screening facility for rapid, efficient and scalable testing.
The mobile facility is part of Parsons’ DetectWise™ suite of health solutions meant to combat the COVID-19 pandemic. SI provided structural design services for the facility.
From 2015 to 2019 Structural Integrity Associates, Inc. (SI) worked with NuScale Power,LLC. to develop structural details for and perform aircraft impact assessments of NuScale’s SMR Reactor Building.The assessments were based on finite element analyses of various strike scenarios stemming from NEI 07-13 guidance.ANACAP, a proprietary SI concrete constitutive model, was used in the finite element analyses.Among other capabilities, the ANACAP model can capture multi-axial tensile cracking, compressive crushing with strain softening, and crack dependent shear stiffness.
This service coincides with the upcoming publication of the Structural Design for Physical Security Manual of Practice by the American Society of Civil Engineers, with TRU Compliance Director Andy Coughlin as coauthor.
TRU Compliance’s testing and certification services is expanding into the dynamic field of Physical Security. This service coincides with the upcoming publication of the Structural Design for Physical Security Manual of Practice by the American Society of Civil Engineers, with TRU Compliance Director Andy Coughlin as coauthor.TRU’s practice in this arena includes Blast, Ballistics, Vehicle Impact and Forced Entry services. This is possible through TRU’s partnerships with leading test laboratories such as Oregon Ballistics Labs, Stone-OBL, BakerRisk, Calspan, and others.Physical Security certification by TRU is accredited by the International Accreditation Service and compliments TRU’s accredited Seismic and Wind Certifications.
In 2018, Structural Integrity Associates, Inc. (SI) supported the United States Army Corp of Engineers (USACE) in the structural assessment of the concrete-to-steel connection in typical I-Section flood walls. A representative flood wall section is shown in Figure 1. This effort was part of a broader scope of work in which the USACE is revising their guidance for the design of flood and retaining walls, EM 1110-2-6066.The purpose of the structural assessment was to better understand the mechanics of load transfer from the reinforced concrete section to the embedded sheet pile. Three-dimensional finite element models of the connection were developed employing non-linear constitutive properties for the concrete, structural steel and reinforcement to achieve this goal.A total of nine different I-Wall configurations with varying wall geometry, sheet pile embedment depth, and connection details were analyzed.Hydrostatic load was applied incrementally to simulate the actual load distribution due to a rising water level.
We may request cookies to be set on your device. We use cookies to let us know when you visit our websites, how you interact with us, to enrich your user experience, and to customize your relationship with our website.
Click on the different category headings to find out more. You can also change some of your preferences. Note that blocking some types of cookies may impact your experience on our websites and the services we are able to offer.
Essential Website Cookies
These cookies are strictly necessary to provide you with services available through our website and to use some of its features.
Because these cookies are strictly necessary to deliver the website, refusing them will have impact how our site functions. You always can block or delete cookies by changing your browser settings and force blocking all cookies on this website. But this will always prompt you to accept/refuse cookies when revisiting our site.
We fully respect if you want to refuse cookies but to avoid asking you again and again kindly allow us to store a cookie for that. You are free to opt out any time or opt in for other cookies to get a better experience. If you refuse cookies we will remove all set cookies in our domain.
We provide you with a list of stored cookies on your computer in our domain so you can check what we stored. Due to security reasons we are not able to show or modify cookies from other domains. You can check these in your browser security settings.
Google Analytics Cookies
These cookies collect information that is used either in aggregate form to help us understand how our website is being used or how effective our marketing campaigns are, or to help us customize our website and application for you in order to enhance your experience.
If you do not want that we track your visit to our site you can disable tracking in your browser here:
Other external services
We also use different external services like Google Webfonts, Google Maps, and external Video providers. Since these providers may collect personal data like your IP address we allow you to block them here. Please be aware that this might heavily reduce the functionality and appearance of our site. Changes will take effect once you reload the page.
Google Webfont Settings:
Google Map Settings:
Google reCaptcha Settings:
Vimeo and Youtube video embeds:
Other cookies
The following cookies are also needed - You can choose if you want to allow them:
Privacy Policy
You can read about our cookies and privacy settings in detail on our Privacy Policy Page.


 NuScale Power,LLC. to develop structural details for and perform aircraft impact assessments of NuScale’s SMR Reactor Building.
 TRU Compliance’s testing and certification services is expanding into the dynamic field of Physical Security. This service coincides with the upcoming publication of the Structural Design for Physical Security Manual of Practice by the American Society of Civil Engineers, with TRU Compliance Director Andy Coughlin as coauthor.
 In 2018, Structural Integrity Associates, Inc. (SI) supported the United States Army Corp of Engineers (USACE) in the structural assessment of the concrete-to-steel connection in typical I-Section flood walls. A representative flood wall section is shown in Figure 1. This effort was part of a broader scope of work in which the USACE is revising their guidance for the design of flood and retaining walls, EM 1110-2-6066.