News & Views, Volume 51 | Forecasting the Life of a Mass Concrete Structure, Part One
A CASE STUDY FROM THE FERMILAB LONG BASELINE FACILITY
By: Keith Kubischta and Andy Coughlin, PE, SE

All around us is aging concrete infrastructure. From the dams holding back water, to the nuclear power plants creating carbon free electricity, to the foundations of our homes and offices. Though many advances have been made in the design of concrete structures, how do we know these structures will stand the test of time. Can we see the future of a concrete structure? Can we know the damage built into a structure during construction, normal life, and extreme events?
Answer: Yes we can.
Background
In Batavia, Illinois a facility being built that is the first of its kind in the world. Fermilab’s Long Baseline Neutrino Facility will accelerate protons using electromagnets up to incredible speeds in a particle accelerator. After traveling through the campus, the particles are redirected to a graphite target where the collision breaks them into their component particles: pions and muons. These components decay and are segregated off. What is left is believed to be the building blocks of the universe: neutrinos, which can pass undisturbed through matter. A beam of neutrinos passes through near detectors and travels over 800 miles underground to a detection facility in an old mineshaft at Sanford Underground Research Facility in South Dakota, a facility that can also detect neutrinos hitting the earth from exploding stars.
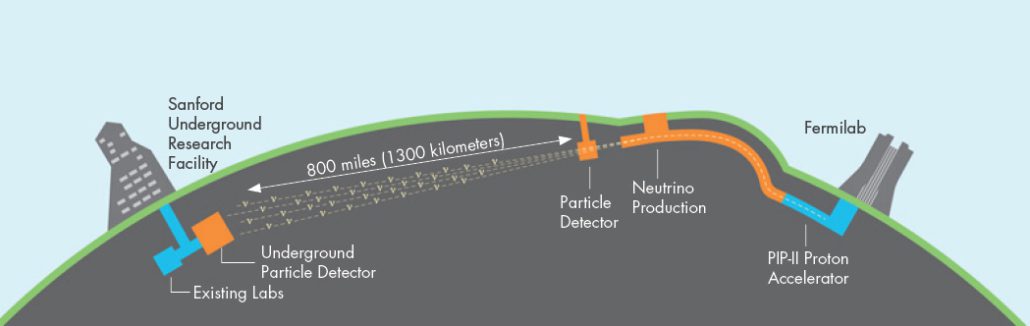
Figure 1. Fermilab Long Baseline Neutrino Facility (source https://mod.fnal.gov/mod/stillphotos/2019/0000/19-0078-02.jpg)
After the graphite collision what is left behind has the potential to create some harmful biproducts such as tritium, or hydrogen-3, which needs to be kept out of the surrounding atmosphere, soil, and ground water. This occurs in the decay region slightly downstream from the target complex, which is 630-ft long concrete tunnel with 18 feet of concrete surrounding the beam line. Exiting the decay tunnel any leftover particles are absorbed downstream in the absorber hall.
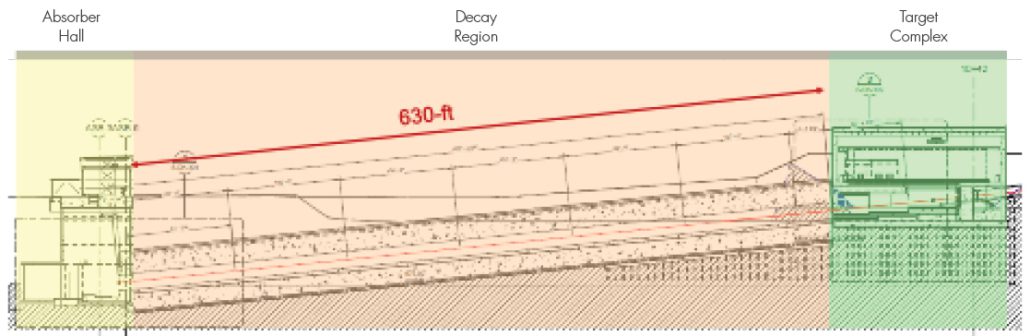
Figure 2. Overview of Decay Region
The tunnel of the decay region houses an octagonal shielding concrete structure to provide shielding for the byproducts. This octagonal structure is over fifty feet tall and wide with 42,000 cubic yards of concrete, enough concrete to construct a baseball stadium. At the center of the tunnel is a double walled stainless steel pressure vessel charged with helium on the inside and a chilled flow of nitrogen gas within the annulus. The octagonal shielding concrete structure is surrounded by an access area to inspect the structure, the outer decay tunnel walls, and the surrounding soil.
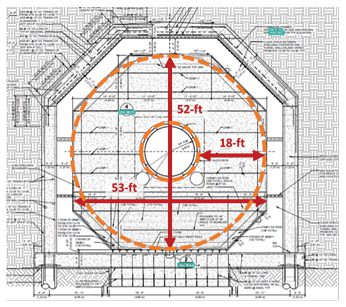
Figure 3. Typical Decay Region Tunnel Cross Section
The octagonal shape of the shielding concrete was not always so octagonal. Starting off with small steps, Structural Integrity demonstrated advanced capabilities to model thermal structural behavior of mass concrete, while developing and expanding on existing capabilities. SI’s positive impact on the early stages of the project earned us a larger role where we displayed additional capabilities to positively influence the design of the structure.
SI followed the design progression and answered some critical questions, such as:
- Will the decay region be within acceptable temperatures when subject to the extreme energy deposition from the decaying particles?
- What thermal expansion joints will be required to prevent cracking, and movement of the underground structures in a harmful way?
- How can we best optimize the reinforcement of such a massive structure?
SI answered these questions and more through expert analysis, expanding our capabilities through proprietary simulation ranging from earlier design concepts, construction stages, and up to including a 50-year design life of the structure.
Part One of this article will look at the influence our work had of the design of the massive structure and the benefits of “seeing the cracks” before they happen.
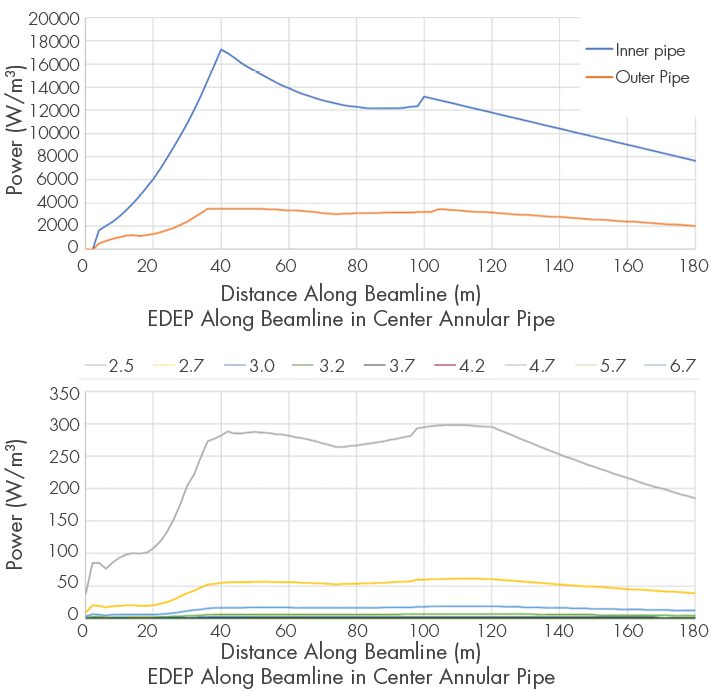
Figure 4. EDEP Axial and Radial Distribution along the Beamline
Energy Deposition and Cooling Thermodynamics
Concrete that gets too hot can vaporize the pore water and even break apart. The transfer of heat in concrete is a critical component of the analysis and is both added to the structure and removed. Thermal loading was provided by Fermilab in the form of volumetric energy deposition (EDEP) on the concrete and steel based on particle physics software simulation program MARS. The distribution of EDEP varies both radial outward from the beamline and compounded by its positioning along the length of the tunnel. SI would need to convert the distribution into a subroutine of distributed flux for use by the analysis program. The distribution was first translated for use in 2D analysis, expanded into 3D space, and then rotated in coordinate space to account for the slope of the beamline. With the EDEP adding heat to the system, chilled nitrogen is needed to remove heat.
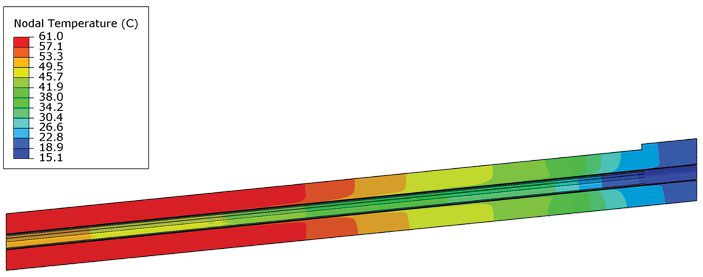
Figure 5. Accurate Thermal Distribution along the Decay Tunnel Shielding Concrete Structure.
A bit of “back-to-school” was needed to solve the thermodynamic problem. The heat transfer coefficient and temperatures of the nitrogen gas cooling system were calculated using classical methods on convection relationships in annular spaces. With the known EDEP into the concrete and steel, which dominates in regions closer to the center, it was decided as a design condition that all heat be taken by the nitrogen to obtain the outflow temperature of the nitrogen gas. The nitrogen temperature was calculated in 10m increments along the annular pressure vessel and at outflow based on an energy balance equation. The heat transfer coefficient was calculated using three different empirical relationships for Nusselt number utilizing the lower bound conservative estimate in the analysis. Our efforts created an accurate model in 3D space of the heat transfer into the shielding concrete. As a result of the nitrogen cooling system, we were able to keep concrete temperatures below the limit of 110 degrees Celsius. With the thermodynamic problem solved, SI progressed, coupling the solution to the mechanical stress model.
Concrete Capabilities
If there is one thing concrete is guaranteed to do, it is to crack. SI’s proprietary concrete constitutive model, ANACAP, is designed to predict concrete cracking and preform under various states of those cracks opening and closing. The behavior of concrete is highly nonlinear with low tensile strength, shear stiffness and strength that depend on crack widths, and plasticity compression. The main components of the concrete model utilized in the design phase analyses are tensile cracking, post-cracking shear performance, and compressive yielding when the compressive strength is reached. The use of the ANACAP concrete model has been validated and verified through 30 years of use and a key component for the nonlinear assessments.

Figure 6. Stepped vs Octagonal Cross Section, Thermal Distributions and Concrete Strain (Cracking)
Influence on Design
Accurate modeling of thermodynamics / thermal analysis, coupling with the mechanical model / stress analysis, and the capabilities of the nonlinear constitutive concrete model allow for the simulation of a full 3D model of the shielding concrete under full power operations. The design team sought to minimize the cracking of the structure, monitor elongations and other movements affecting the beam line, and design connections at the structure boundaries. SI coordinated with research and design teams to facilitate several cross-section iterations with different shapes and layers of shielding. Each design iteration was analyzed to demonstrate the benefits or consequences. An early iteration of the shield concrete cross-section was a stepped block shape. The corners of the stepped cross-section displayed the potential for cracking. SI addressed this potential design trait through influencing the development of the octagonal section shape. This optimization allows the design to minimize the amount of reinforcement needed to control cracking.
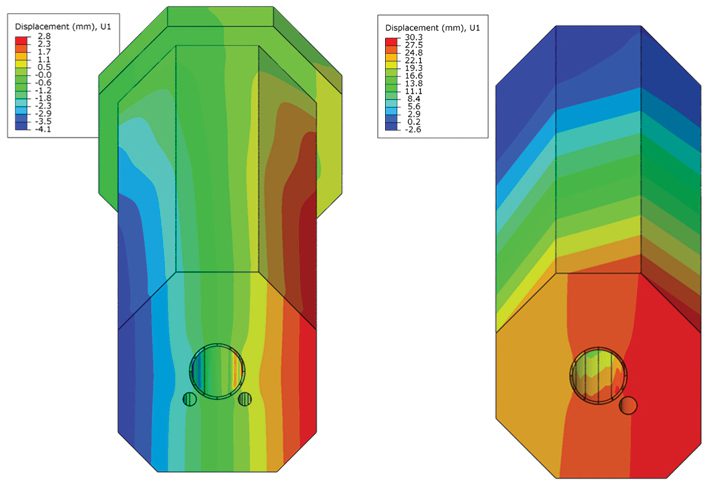
Figure 7. Lateral Displacements of Single Return Pipe and Dual Return Pipe
In addition to the cooling annulus at the center of the structure, there are the return ducts for the system to bring the nitrogen back to the target complex facility. The design initially used four return pipes spread out at four different corners. In one iteration the design team attempted to reduce the four return ducts to one larger return pipe to reduce the concrete volume required for shielding. The design iteration with one return duct was attempting to reduce costs by reducing the overall amount of concrete needed. Our calculations quickly identified unintended consequences. The asymmetrical shape was creating displacements along the transverse horizontal direction, pushing the beam alignment off-center by over an inch (~30 mm). The shape was quickly updated to be symmetric with two return pipes.
From room temperature to 60 degrees Celsius, concrete is going to expand. Traditional thermal breaks cannot be utilized in this structure to maintain continuity and provide shielding. The design needed to allow the structure to expand at the downstream end. Most of the structure is supported by rails where it was designed to freely slide at the bottom of the octagonal section during the expansion phase. A section of these rails needs to be fixed at the upstream end where it was designed to resist the gravity of the structure along the slope. SI provided valuable design influence with where the fixed rails were to be positioned as the thermal loading created immense stress at the location between the fixed boundary and sliding boundary. In the original position, SI’s calculations identified a concentrated area of cracking. To minimize the amount of cracking and additional reinforcement needed, SI proposed moving the position of restraint towards the cool / upstream end of the tunnel.
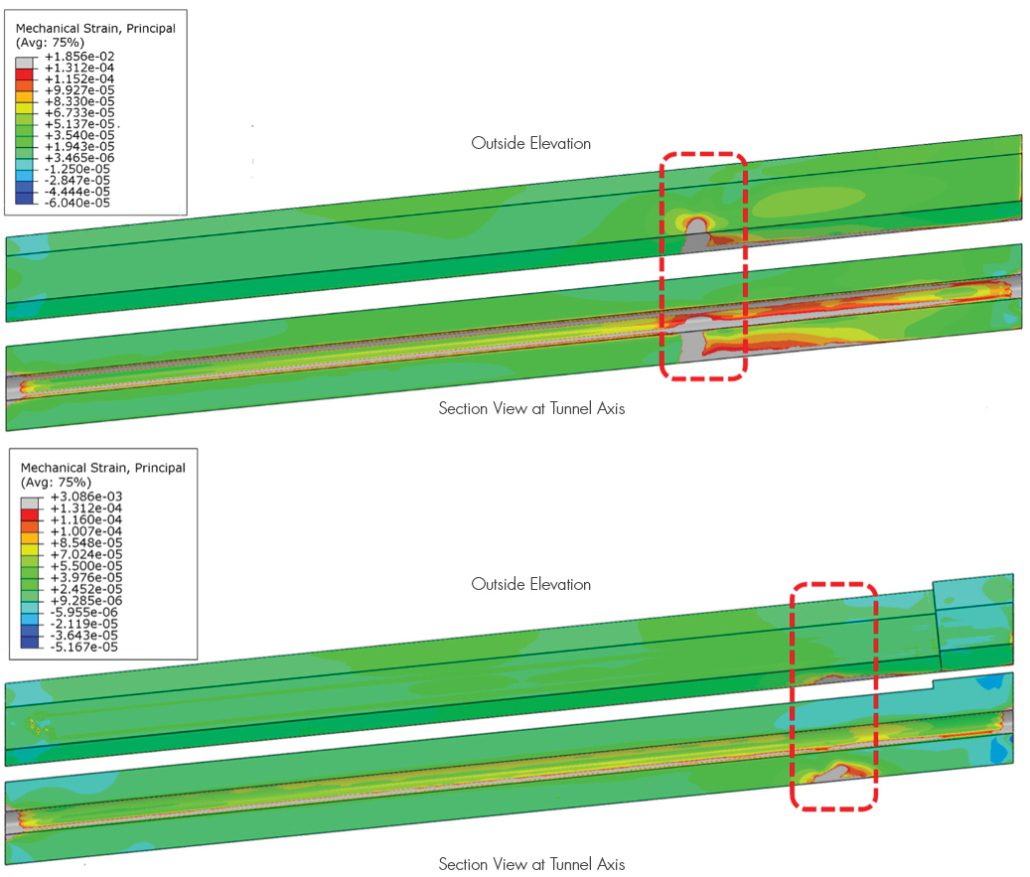
Figure 8. Effect of Fixed Rail Boundary Condition Position on Strain.
How do you stop 42,000 cubic yards of concrete from expanding?
Answer: You Don’t.
Conclusions
Structural Integrity successfully developed expanded capabilities to model thermodynamics for the energy deposition and nitrogen cooling system. SI used the capabilities of our concrete model to influence the structural design by “seeing the cracks” before they happen, making design adjustments, and reducing reliance on additional reinforcement. SI was able to give key insights for the concrete structure and potential cost savings through optimization.
Part Two of this article will look at the life of the structure form the day concrete is first poured to 30 years of power cycles. Delving into the future to see this structures test of time and monitoring methods to see if our predictions come true.