News & Views, Volume 52 | Forecasting the Life of a Mass Concrete Structure, Part Two
A CASE STUDY FROM THE FERMILAB LONG BASELINE FACILITY
By: Keith Kubischta and Andy Coughlin, PE, SE
REFRESHER OF PART 1
From part one of the article (see News and Views Volume 51), we looked at the performance of a unique tubular mass concrete structure – the decay region of Fermilab’s Long Baseline Neutrino Facility – under complex thermal loading and thermal expansion. In the process of colliding subatomic particles in an accelerator and beaming them across the country underground, the facility contends with a massive amount of heat, an active nitrogen cooling system to remove energy, and shielding necessary for the surrounding environment. As we discussed in Part 1, Structural Integrity assisted with the design of the concrete structure by calculating the pertinent structural and thermal behavior under normal operation. Now for Part 2, we focus on forecasting the future life of the structure using advanced capabilities in analysis and delve into the actual life of this concrete structure while considering the construction process, a 30 year planned cycle of life, and how these influence planning for structural monitoring systems. In doing so, we attempt to answer a larger question: What can we learn from this structure that could be applied to other past and future structures?
These methods are not only applicable to new structures. Armed with the knowledge we can gain from record drawings, visual inspection, and non-destructive examination, SI is able to predict the life of concrete structures, new and old, giving key insights into their behavior in the future.

Figure 1. Fermilab Long Baseline Neutrino Facility (source https://mod.fnal.gov/mod/stillphotos/2019/0000/19-0078-02.jpg)
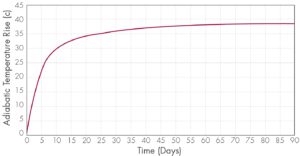
Figure 2. Adiabatic Temperature Rise for Concrete Placement
HEAT OF HYDRATION
In understanding the life of a structure, we must first start at the beginning as the concrete is first poured where another heat transfer takes place. Contrary to popular belief, concrete does not “dry”, rather it “bakes” itself during the curing process. As concrete is poured, it begins heating up internally through an exothermic hydration reaction between water and cement. The effect of the heat of hydration can usually be ignored in typical thin-walled structures. In larger mass concrete structures, however, the heat generation can cause significant degradation and built-in damage that can affect the structural performance throughout the entire life of the facility.
A secondary subroutine as part of the ANACAP models is used for heat of hydration specific for construction analysis to convert the temperature rise into volumetric heat generation rate for thermal analysis. When heat is trapped deep inside the structure and can’t escape, the concrete exhibits a temperature rise similar to the curve in Figure 2, which is a function of the concrete mix proportions.
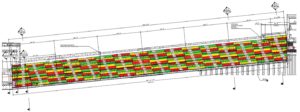
Figure 3. Placement Sequence of 164 Concrete Pours
CONSTRUCTION ASSESSMENTS
For the operating conditions covered in Part 1, the coupled 3D thermal stress analyses performed on this project were thermal conduction steady-state analyses. Construction of such a large concrete structure is subjected to additional requirements, and a Nonlinear Incremental Structural Analysis (NISA) was performed to evaluate the structure under the construction loadings. Herein, the thermal analysis during the concrete placement sequence requires a transient numerical solution methodology. This thermal analysis was used to monitor additional requirements for temperature during concrete placement, and a mechanical NISA study monitored the movement of the central cooling annulus vessel. The complete NISA coupled thermal-stress analysis simulated the entire construction phase over the period of a year and a half of the planned construction schedule. To accomplish this, the model was segmented into 164 concrete pours, each one activated (turned on) within the model on a specific day outlined in a construction schedule, as shown in Figure 3. As the concrete is poured on its specific day, the heat of hydration begins to heat up the internals of the concrete, the outside ambient temperature pulls the heat away from the concrete, and formwork insulates the heat transfer temporarily before being removed. As each new concrete segment is poured (activated in the simulation) it begins a new heat cycle, shedding heat into surrounding segments, changing surfaces that are exposed to air, or where the formwork is located. Upon completion of the thermal NISA study, Structural Integrity could advise on peak temperatures of each pour (Figure 4), compare internal to external temperatures and make optimal recommendations for insulation to keep the concrete from cooling too fast.
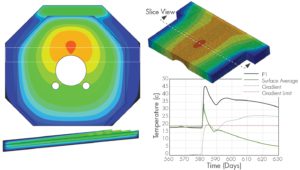
Figure 4. Thermal Views and Monitoring of Concrete Placement Temperatures
With the thermal NISA study completed, we then coupled the thermal with the mechanical stress analysis following a similar procedure. The model was broken up into the same 164 segments, with the reinforcement separated into individual segments. As a segment was poured, its weight was first applied as pressure on surrounding segments before the segment cured enough and took load. Formwork was considered a temporary boundary condition (simulated with stiff springs): activated then removed when appropriate. The concrete internal reinforcement was activated with each concrete segment. The cycles continue with each additional segment added. The concrete material for each segment had its own values for aging, creep, shrinkage, and thermal degradation for when the concrete was placed. The effect of creep and shrinkage could be significantly different for concrete poured on the first day and concrete that is poured a year later. Mechanical tensile strain, a proxy for cracking, was plotted as shown in Figure 5.
A critical issue of concern was the steel annulus structure at the center of the concrete tunnel. The entire steel structure was placed prior to concrete being poured around it. The steel structure was affected by the thermal and mechanical loads of each concrete pour. Structural Integrity showed this structure “breathing” as thermal/mechanical loads pass from each concrete pour into the steel structure. Armed with a complete picture from the NISA stress analysis, Structural Integrity could show the animation of annulus movement, check the out-of-roundness, and advise on reinforcement placement.
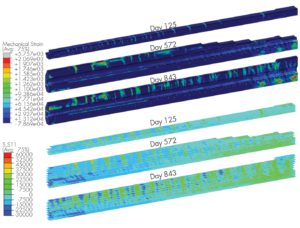
Figure 5. Concrete Mechanical Strain (i.e., Cracking) and Rebar Stress During NISA Construction
LIFECYCLE ASSESSMENTS
During the design phase, reinforced concrete structures are typically designed for a bounding range of expected loads, to include thermal load cycles, periodic live load variations, and/or vibration from mechanical equipment. Up to this point, the design phase analysis started from a “pristine” uncracked structure and applied the expected load with the beam and cooling at full power. Seldom is the cumulative impact of cyclic loading considered for the expected service life of the structure. Structural Integrity, having performed the NISA study, now had significantly more accurate state of the structure with expected cumulative damage already built-up. This gave us the unique opportunity to extend the analysis from the current state through the lifecycle of the structure, comparing the “pristine” to the “cumulative” case.
The expected life of the structure is 30 years of operations with the beam running for no more than nine months a year and three months off. These cycles are grouped together in either seven- or five-year blocks with a rest period of two years for maintenance or upgrades in between. The experiment starts small, ramping up the power to half the total output for the initial seven years. For the lifecycle assessment, time is still a critical element, not just for properties of concrete affected by time but the physical computational time. The transient thermal analysis would be too time intensive to run over the 30 years of life that we want to observe. To simulate the thermal cycles, the beam steady-state thermal response was calculated at each peak power level. This provided different thermal states of power, which the mechanical analysis could switch on or off as needed and interpolate between them to give a simulated ramp of power. The computational time could then be utilized on the mechanical stress lifecycle assessment.
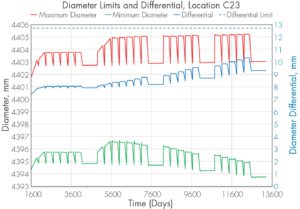
Figure 6. Out-of-Roundness Check through Lifecycle, Ratcheting Effect of Power Cycles
With the completion of the lifecycles analysis, Structural Integrity could once again provide valuable information to the researchers and designers: deformations of the entire structure, deformations of the annulus, out-of-roundness of the annulus (Figure 6), estimates of crack width, etc.
Most importantly, we can answer and show comparisons between the designed load from a “pristine” model analysis to those from the “cumulative” analysis.
Even prior to the lifecycle assessment, the cumulative damage at the end of the NISA study signaled different behavior in the expected cracking (Figure 7). From the construction process, the concrete showed cracking near the boundaries between each concrete pour. These developed due to the natural thermal cycling of the construction process. The lifecycle thermal loading continued to push and pull the structure adding to the already existing cracks. Previously, the boundary point between the fixed rail and sliding rail section concentrated the thermal loading to induce significant cracking. Now the stress will be more evenly distributed throughout the upstream section. The cracking during construction provided natural thermal breaks along the whole length of the structure.
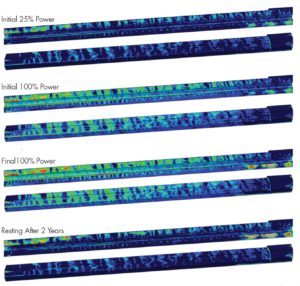
Figure 7. Concrete Strains at Various Point in Structures Lifecycle
HEAT DISPERSAL
SI then turned toward an additional question, where does all this excess heat go as the beam is cycling power? The shielding concrete is still heating up to over 60 degrees Celsius at the exposed surfaces. The air around the shielding concrete is trapped by the decay tunnel and venting conditions are unknown. We would need to produce a calculation based on the transfer of heat from the shielding concrete to the surrounding air/access tunnel, to the decay tunnel itself, and then the surrounding soil. Assuming the worst-case scenario, a point was selected along the length of the tunnel that produces maximum temperatures in the concrete. The cross section at this point is turned into a 2D model for use in a thermal analysis conducted as steady-state and transient to explore the heat transfer into the surrounding sections. A temperature profile of the decay tunnel wall was used to check its design from the thermal gradients, shown in Figure 9. The temperature of the air space between the structures can be monitored help in planning for when the tunnel can safely be accessed.
ONLINE MONITORING
Engineers at SI are always eager to add data to our models. As this structure is constructed and put into service, the actual construction and startup sequence is likely to change, allowing for the model to be rerun and the lifecycle projection recalculated. Furthermore, data from temperature sensors and crack monitoring gauges could potentially help calibrate the model based on observed conditions to improve the accuracy of our projections moving forward. This methodology is applicable today to existing aging concrete structures where the lifecycle projection can be calibrated to existing observed conditions and data from online monitoring and non-destructive examinations.
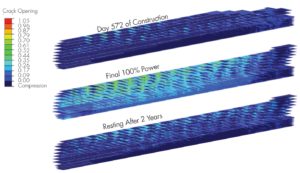
Figure 8. Crack Width Estimation Based on Reinforcement Strain
CONCLUSIONS
Structural Integrity successfully developed expanded capabilities to model thermodynamics for the energy deposition and nitrogen cooling system. SI pushed the capabilities of our concrete model to capture over 30 years of construction and operations. Along the way, SI showed that our advanced modeling, combined with our advanced concrete model, positively influenced the design of the structure, and heavily supported the design and research teams with valuable information. The robustness of the calculation showed that SI is the present and future of concrete structure analysis.
SI demonstrated that our advanced modeling, combined with our advanced concrete model, positively influenced the design of this structure and heavily supported both the research and design teams with valuable information.
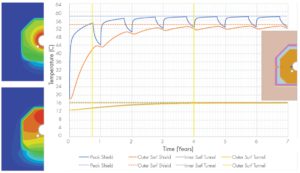
Figure 9. 2D Thermal Results of Decay Tunnel, Air Access Space, Shield Tunnel Walls, and Surrounding Soil