News & Views, Volume 52 | 
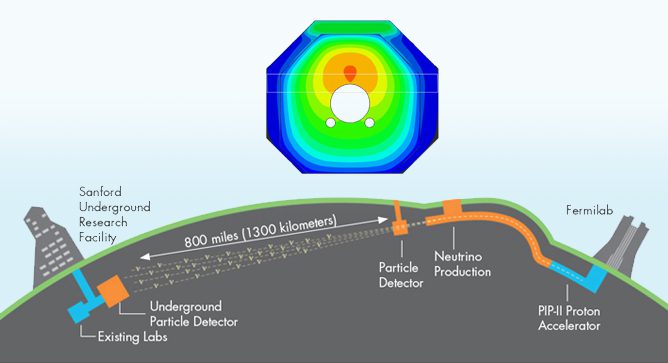
Forecasting the Life of a Mass Concrete Structure, Part Two

A CASE STUDY FROM THE FERMILAB LONG BASELINE FACILITY

By:  Keith Kubischta and Andy Coughlin, PE, SE

REFRESHER OF PART 1
From part one of the article (see News and Views Volume 51), we looked at the performance of a unique tubular mass concrete structure – the decay region of Fermilab’s Long Baseline Neutrino Facility – under complex thermal loading and thermal expansion. In the process of colliding subatomic particles in an accelerator and beaming them across the country underground, the facility contends with a massive amount of heat, an active nitrogen cooling system to remove energy, and shielding necessary for the surrounding environment. As we discussed in Part 1, Structural Integrity assisted with the design of the concrete structure by calculating the pertinent structural and thermal behavior under normal operation.  Now for Part 2, we focus on forecasting the future life of the structure using advanced capabilities in analysis and delve into the actual life of this concrete structure while considering the construction process, a 30 year planned cycle of life, and how these influence planning for structural monitoring systems. In doing so, we attempt to answer a larger question: What can we learn from this structure that could be applied to other past and future structures?

These methods are not only applicable to new structures.  Armed with the knowledge we can gain from record drawings, visual inspection, and non-destructive examination, SI is able to predict the life of concrete structures, new and old, giving key insights into their behavior in the future.

Figure 1. Fermilab Long Baseline Neutrino Facility (source https://mod.fnal.gov/mod/stillphotos/2019/0000/19-0078-02.jpg)

Figure 2. Adiabatic Temperature Rise for Concrete Placement

HEAT OF HYDRATION
In understanding the life of a structure, we must first start at the beginning as the concrete is first poured where another heat transfer takes place. Contrary to popular belief, concrete does not “dry”, rather it “bakes” itself during the curing process. As concrete is poured, it begins heating up internally through an exothermic hydration reaction between water and cement. The effect of the heat of hydration can usually be ignored in typical thin-walled structures. In larger mass concrete structures, however, the heat generation can cause significant degradation and built-in damage that can affect the structural performance throughout the entire life of the facility. 

A secondary subroutine as part of the ANACAP models is used for heat of hydration specific for construction analysis to convert the temperature rise into volumetric heat generation rate for thermal analysis. When heat is trapped deep inside the structure and can’t escape, the concrete exhibits a temperature rise similar to the curve in Figure 2, which is a function of the concrete mix proportions.

Figure 3. Placement Sequence of 164 Concrete Pours

CONSTRUCTION ASSESSMENTS
For the operating conditions covered in Part 1, the coupled 3D thermal stress analyses performed on this project were thermal conduction steady-state analyses. Construction of such a large concrete structure is subjected to additional requirements, and a Nonlinear Incremental Structural Analysis (NISA) was performed to evaluate the structure under the construction loadings. Herein, the thermal analysis during the concrete placement sequence requires a transient numerical solution methodology. This thermal analysis was used to monitor additional requirements for temperature during concrete placement, and a mechanical NISA study monitored the movement of the central cooling annulus vessel. The complete NISA coupled thermal-stress analysis simulated the entire construction phase over the period of a year and a half of the planned construction schedule. To accomplish this, the model was segmented into 164 concrete pours, each one activated (turned on) within the model on a specific day outlined in a construction schedule, as shown in Figure 3. As the concrete is poured on its specific day, the heat of hydration begins to heat up the internals of the concrete, the outside ambient temperature pulls the heat away from the concrete, and formwork insulates the heat transfer temporarily before being removed. As each new concrete segment is poured (activated in the simulation) it begins a new heat cycle, shedding heat into surrounding segments, changing surfaces that are exposed to air, or where the formwork is located. Upon completion of the thermal NISA study, Structural Integrity could advise on peak temperatures of each pour (Figure 4), compare internal to external temperatures and make optimal recommendations for insulation to keep the concrete from cooling too fast.

Figure 4. Thermal Views and Monitoring of Concrete Placement Temperatures

With the thermal NISA study completed, we then coupled the thermal with the mechanical stress analysis following a similar procedure. The model was broken up into the same 164 segments, with the reinforcement separated into individual segments. As a segment was poured, its weight was first applied as pressure on surrounding segments before the segment cured enough and took load. Formwork was considered a temporary boundary condition (simulated with stiff springs): activated then removed when appropriate. The concrete internal reinforcement was activated with each concrete segment. The cycles continue with each additional segment added. The concrete material for each segment had its own values for aging, creep, shrinkage, and thermal degradation for when the concrete was placed. The effect of creep and shrinkage could be significantly different for concrete poured on the first day and concrete that is poured a year later.  Mechanical tensile strain, a proxy for cracking, was plotted as shown in Figure 5.

A critical issue of concern was the steel annulus structure at the center of the concrete tunnel. The entire steel structure was placed prior to concrete being poured around it. The steel structure was affected by the thermal and mechanical loads of each concrete pour. Structural Integrity showed this structure “breathing” as thermal/mechanical loads pass from each concrete pour into the steel structure. Armed with a complete picture from the NISA stress analysis, Structural Integrity could show the animation of annulus movement, check the out-of-roundness, and advise on reinforcement placement. 

Figure 5. Concrete Mechanical Strain (i.e., Cracking) and Rebar Stress During NISA Construction

LIFECYCLE ASSESSMENTS
During the design phase, reinforced concrete structures are typically designed for a bounding range of expected loads, to include thermal load cycles, periodic live load variations, and/or vibration from mechanical equipment. Up to this point, the design phase analysis started from a “pristine” uncracked structure and applied the expected load with the beam and cooling at full power. Seldom is the cumulative impact of cyclic loading considered for the expected service life of the structure. Structural Integrity, having performed the NISA study, now had significantly more accurate state of the structure with expected cumulative damage already built-up. This gave us the unique opportunity to extend the analysis from the current state through the lifecycle of the structure, comparing the “pristine” to the “cumulative” case.

The expected life of the structure is 30 years of operations with the beam running for no more than nine months a year and three months off. These cycles are grouped together in either seven- or five-year blocks with a rest period of two years for maintenance or upgrades in between. The experiment starts small, ramping up the power to half the total output for the initial seven years. For the lifecycle assessment, time is still a critical element, not just for properties of concrete affected by time but the physical computational time. The transient thermal analysis would be too time intensive to run over the 30 years of life that we want to observe. To simulate the thermal cycles, the beam steady-state thermal response was calculated at each peak power level. This provided different thermal states of power, which the mechanical analysis could switch on or off as needed and interpolate between them to give a simulated ramp of power. The computational time could then be utilized on the mechanical stress lifecycle assessment.

Figure 6. Out-of-Roundness Check through Lifecycle, Ratcheting Effect of Power Cycles

With the completion of the lifecycles analysis, Structural Integrity could once again provide valuable information to the researchers and designers: deformations of the entire structure, deformations of the annulus, out-of-roundness of the annulus (Figure 6), estimates of crack width, etc.

Most importantly, we can answer and show comparisons between the designed load from a “pristine” model analysis to those from the “cumulative” analysis.

Even prior to the lifecycle assessment, the cumulative damage at the end of the NISA study signaled different behavior in the expected cracking (Figure 7). From the construction process, the concrete showed cracking near the boundaries between each concrete pour. These developed due to the natural thermal cycling of the construction process. The lifecycle thermal loading continued to push and pull the structure adding to the already existing cracks. Previously, the boundary point between the fixed rail and sliding rail section concentrated the thermal loading to induce significant cracking. Now the stress will be more evenly distributed throughout the upstream section. The cracking during construction provided natural thermal breaks along the whole length of the structure.

Figure 7. Concrete Strains at Various Point in Structures Lifecycle

HEAT DISPERSAL
SI then turned toward an additional question, where does all this excess heat go as the beam is cycling power? The shielding concrete is still heating up to over 60 degrees Celsius at the exposed surfaces. The air around the shielding concrete is trapped by the decay tunnel and venting conditions are unknown. We would need to produce a calculation based on the transfer of heat from the shielding concrete to the surrounding air/access tunnel, to the decay tunnel itself, and then the surrounding soil. Assuming the worst-case scenario, a point was selected along the length of the tunnel that produces maximum temperatures in the concrete. The cross section at this point is turned into a 2D model for use in a thermal analysis conducted as steady-state and transient to explore the heat transfer into the surrounding sections. A temperature profile of the decay tunnel wall was used to check its design from the thermal gradients, shown in Figure 9. The temperature of the air space between the structures can be monitored help in planning for when the tunnel can safely be accessed.

ONLINE MONITORING
Engineers at SI are always eager to add data to our models.  As this structure is constructed and put into service, the actual construction and startup sequence is likely to change, allowing for the model to be rerun and the lifecycle projection recalculated.  Furthermore, data from temperature sensors and crack monitoring gauges could potentially help calibrate the model based on observed conditions to improve the accuracy of our projections moving forward.  This methodology is applicable today to existing aging concrete structures where the lifecycle projection can be calibrated to existing observed conditions and data from online monitoring and non-destructive examinations.

Figure 8. Crack Width Estimation Based on Reinforcement Strain

CONCLUSIONS
Structural Integrity successfully developed expanded capabilities to model thermodynamics for the energy deposition and nitrogen cooling system. SI pushed the capabilities of our concrete model to capture over 30 years of construction and operations. Along the way, SI showed that our advanced modeling, combined with our advanced concrete model, positively influenced the design of the structure, and heavily supported the design and research teams with valuable information. The robustness of the calculation showed that SI is the present and future of concrete structure analysis.

SI demonstrated that our advanced modeling, combined with our advanced concrete model, positively influenced the design of this structure and heavily supported both the research and design teams with valuable information.

Figure 9. 2D Thermal Results of Decay Tunnel, Air Access Space, Shield Tunnel Walls, and Surrounding Soil

Get News & Views, Volume 52

News & Views, Volume 52 | Heat Exchanger Tube Sheet Reliability Analysis

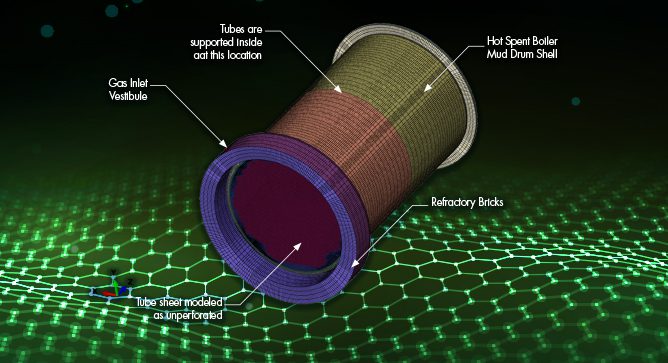
By:  Kannan Subramanian, PhD, PE, FASME & Dan Parker, PE

BACKGROUND

The hot section of a waste heat boiler, also known as the hot spent boiler, is an essential component in the regeneration of spent sulfuric acid in chemical plants that process sulfur. Due to the ever-increasing demand for sulfuric acid and other sulfur compounds, this is critical equipment as its operation results in sold-out production. As a result, these boilers need maximum uptime between scheduled maintenance outages; any unscheduled shutdowns to repair and/ or replace tubes and tube sheets directly translate into lost revenues for the plant. This article addresses the reliability issues of one such boiler located in a Louisiana chemical plant. 

GOAL: Predict the minimum number of tubes to plug, minimize downtime and allow regular operation until the next planned maintenance.  

Figure 1. Hot Spent Boiler (shaded in red) in a waste heat recovery unit Flue Gas Tube Boiler.

Figure 2. Tube-to-tube sheet joint failures and tube sheet leak

The boiler being assessed was part of an arrangement (Figure 1), with two fire tube boilers in parallel with a common external steam drum. In the case of the single boiler assessed by SI, the tubes were experiencing periodic tube leaks as the boiler was approaching the end of service life where tube failure frequency increases. As typical, there may be a single tube leak or several in the same proximity (Figure 2). Some proactive plugging has been applied based on historical performance (Figure 3(a)). In SI’s experience, tubes adjacent to a plugged tube may fail a short time after the plug is installed as there is an undefined temperature/stress interaction. In addition to tube leaks, general corrosion and tube sheet thinning can be a consequence of tube leaks (Figure 2(c). Excessive tube sheet thinning is not uncommon due to the formation of sulfuric acid that exacerbates the corrosion issue. With these consequences in mind, it is critical that the proper number of tubes be plugged to stop the costly cascade of failures. 

To bring the boiler back to service, in early January of 2022, the leaking tubes and a few other tubes around the leaking tubes were plugged. In addition, to repair the leaking location in the tube sheet knuckle region, welding followed by post-weld heat treatment was performed (Figure 3(b)). Within a few weeks after this repair, additional tube leaks were discovered and required plugging. Such frequent leaks and repairs result in production loss and unplanned expenses. To minimize those, SI was contracted to develop an engineering basis for tube plugging, which would be proactive for equipment reliability, but not produce over-plugging that affects the boiler heat duty. To achieve this, the engineering assessment should involve an advanced analytical study to understand the following:

  • Tube leaks
  • Effect of repair, PWHT, and additional plugging on adjacent unplugged tubes
  • Effect of tube sheet metal loss on the integrity of the tube sheet

This article covers both the historic details of the failures and subsequent repairs and provides a comparison of the failures documented on-site with the analytical results determined from the approach implemented by SI. 

Figure 3. Hot Spent Boiler Plugging and Repair Welding

METHODOLOGY & CRITERIA

The overall approach adopted by SI: 

  • Develop finite element (FE) model to study design deficiencies, if any, using elastic analyses. That is, perform an elastic finite element analysis (FEA).
  • Develop a criterion to study the tube-to-tube sheet integrity.
  • Using the same FE model, perform elastic-plastic analyses to determine the effect of repair and PWHT. 
    • This is to determine if any additional tubes should be plugged to reduce any adverse effects.
    • This is a sequentially coupled thermal-stress analysis.
  • Calculate the minimum required thickness for the various sections of the waste heat boiler.
Table 1. Criteria Used in the Analyses

Table 1. Criteria Used in the Analyses

Table 1 illustrates the criteria considered for the work described herein. Several stress magnitudes were considered, such as the tube material allowable stress, tube-to-tube sheet joint allowable stress, and the ratcheting limit. Typically, when elastic analyses are performed, ratcheting limits are helpful. However, this work did not utilize the ratcheting limit. The tube-to-tube sheet joint allowable stress and load are calculated using Section VIII, Div. 1, Nonmandatory Appendix A. The allowable stress and load are compared against the equivalent stresses and tube axial loads, respectively, from the FEA to determine the mechanical integrity of the tube-to-tube sheet location. However, since there exists a parallel damage mechanism (general corrosion), the yield strength of the tube is set as a limit to add conservatism.

Figure 4. Hot Spent Boiler as Modeled in FEA


ANALYSES & RESULTS

Since the methodology requires the use of advanced analytical methods, an FEA model (Figure 4) was built and analyzed using the commercial FEA software package – Abaqus. The model included sufficient lengths of gas inlet and outlet sections, the tube support location at the mid-section of the mud drum, the refractory, and the brackets that connect the hot section with the boiler drum. Since the nozzles are far from the area of interest, they are not included in the model. Appropriate element types were utilized for this work. One notable feature is the use of beam elements for the tubes (Figure 5). Since the model includes hundreds of tubes, incorporating a solid tube and heat exchanger model adds both geometric and numerical complexity. The use of beam elements simplifies the model while significantly minimizing the numerical convergence issues when compared with the full solid models. 

Figure 5. Hot Spent Boiler Tubes Inside the FEA Model

All the analyses performed are thermo-mechanical analyses, wherein a heat transfer/thermal analysis is performed first, and the temperature profile from the thermal analysis is imposed along with respective mechanical loads in the subsequent stress/mechanical analysis. Initially, elastic models were used to assess the design adequacy of the subject boiler and to determine the bounding operating conditions for further analyses involving the repair process. For the analyses involving the weld repair and the post weld heat treatment (PWHT) followed by operating conditions, the sequence of steps is critical. SI discussed the methodology with the client when developing the accurate sequence to be included in the FEA. As stated earlier, to capture the effect of residual stresses (after welding and PWHT processes) on the corroded tube sheet section at the bottom where the leak was discovered, an elastic-plastic FEA is essential. Temperature results from the welding process step are shown in Figure 6. After welding and PWHT, the process conditions were applied to the model along with the number of plugged tubes at the time. Figure 7 illustrates the temperature distribution in the tube sheet, boiler drum, and tubes. Since the plugged tubes do not transport flue gas, the temperature of those tubes is the same as the water temperature around those tubes inside the drum.

Since the number of tubes is significant, post-processing of results is a challenge. SI developed a procedure to overlay the von Mises equivalent stress results on a spreadsheet layout that resembles the actual tube layout in the tube sheet. It is further simplified for better visualization in this article, as shown in Figures 8 through 10. Figure 10 (a) shows a historical perspective of the tube plugging over time. In the first set of analyses that SI performed, only the locations shown with greyish blue color (tubes plugged before Jan. 2022) were considered as plugged. The thermal analysis results for this case are shown in Figure 7. After performing the mechanical/stress analysis, it was observed that the unplugged tube locations shown in Figure 8 (a) with orange and red dots are of concern. The orange dot locations indicate the locations with stresses greater than the tube yield strength. The red dot locations indicate that the stresses exceeded the allowable stress. Since the criteria are set at joint location stresses exceeding the tube allowable stresses, both orange and red dot locations require tube plugging. Figure 8 (b) shows the locations where further tube leaks were discovered within weeks of the weld repair and plugging. The tube leak locations are identified with yellow marks. This gives the confidence that such analytical methods, when appropriately applied, can predict the locations of future failures.

Figure 6. Repair Welding Simulation – Heat Transfer Analysis

Figure 7. Post Repair and Plugging Process Conditions – Heat Transfer Analysis

After the discovery of the new leaks, further plugging was undertaken. These locations are identified by light blue dots in Figure 10 (a). SI incorporated these changes in the analyses and determined that the locations shown in red and orange dots in Figure 8 (a) are still a concern, as shown in Figure 9 (a). This was later confirmed by further tube leaks (see Figure 9 (b)) found after 6 weeks of the previous plugging was completed. This further assured the value of performing such an engineering-based approach rather than a traditional grand-fathering approach which would use plugging methods adapted for similar units based on historical information. It should be noted that SI was engaged in this study at the period between weld repair and second set of plugging as shown in Figure 8. However, all the results were made available just prior to the third leak shown in Figure 9 (b). At this time, the Client utilized the results from the FEA and decided to add additional tube plugging as shown in Figure 10. SI performed analyses with the final set of plugging, and the results indicated that other tube locations around the plugged tube locations are not of concern (see Figure 10 (b)).

Figure 8. Post Repair and Plugging Process Conditions Criteria Check and Field Observation

Figure 9. Additional Plugging and Field Observation after that Plugging

The last set of analyses were performed in mid-March of 2022, and after 6 months, the boiler did not experience any further leaks. While the engineering approach predicted the issues, it is cautioned that any engineering analysis can only simulate the known degraded material thickness and properties in the analysis and not the corrosion degradation mechanism itself. The rate of deterioration and the interaction of various damage mechanisms should be monitored by the operator.

Figure 10. Tube plugging to-date and tube-to-tube sheet joint stress state

CONCLUSIONS

  • The original, as-installed condition did not show significant issues. It is believed that other damage mechanisms caused the initial failures leading to the plugging of tubes around the periphery of the tube sheet.
  • The study captured the recent joint issues, specifically the failure after the plugging and repair weld performed in early January 2022. 
  • Thinner regions are more prone to further failure. The minimum required thickness using the same criteria is established for the tube sheet.
  • The analysis was successful in predicting the minimum number of tubes to plug.
  • Plugging the correct number of tubes stopped the typical tube failure cascade.
  • The applied results were directly proven. Once the results were fully implemented, the waste heat boiler had no unplanned shutdowns. The analysis met its goal and provided a major business impact.
  • Analysts need sufficient information to minimize assumptions and make a robust model.
  • Clear understanding of API 579, ASME Section VIII Div. 1, ASME Section I, and FEA is necessary to develop robust, realistic, and relevant engineering solutions.

Get News & Views, Volume 52