
A CASE STUDY ON IMPLEMENTATION AT A 3X1 COMBINED CYCLE FACILITY (ARTICLE 1 OF 3)
By: Kane Riggenbach and Ben Ruchte
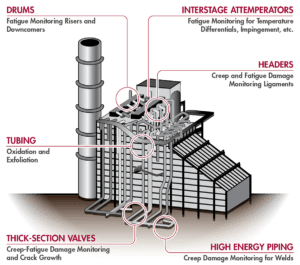
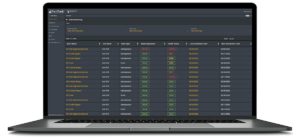
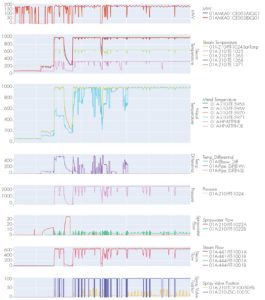
SI has successfully implemented a real-time, online, damage monitoring system for the Heat Recovery Steam Generators (HRSGs) at a combined cycle plant with a 3×1 configuration (3 HRSGs providing steam to a single steam turbine). The system is configured to quantify and monitor the life limiting effects of creep and fatigue at select locations on each of the HRSGs (e.g. attemperators, headers, and drums – see Figure 1). The brand name for this system is SIIQ™, which exists as a monitoring solution for high energy piping (HEP) systems and/or HRSG pressure-part components. SIIQ™ utilizes off-the-shelf sensors (e.g. surface-mounted thermocouples) and existing instrumentation (e.g. thermowells, pressure taps, flow transmitters, etc.) via secure access to the data historian. The incorporation of this data into SI’s damage accumulation algorithms generates results that are then displayed within the online monitoring module of SI’s PlantTrack™ data management system (example of the dashboard display shown in Figure 2).
This article will be part of a series discussing items such as the background for monitoring, implementation/monitoring location selection, and future results for the 3×1 combined cycle plant.
- Article 1 (current): Introduction to SIIQ™ with common locations for monitoring within HRSGs (and sections of HEP systems)
- Article 2: Process of SIIQ™ implementation for the 3×1 facility with a discussion of the technical foundation for damage tracking
- Article 3: Presentation of results from at least 6+ months, or another appropriate timeframe, of online monitoring data
 BASIS FOR MONITORING
The owner of the plant implemented the system with the desire of optimizing operations and maintenance expenses by reducing inspections or at least focusing inspections on the highest risk locations. The system has been in place for a few months now and is continuously updating risk ranking of the equipment and ‘action’ intervals. The ‘action’ recommended may be operational review, further analysis, or inspections. This information is now being used to determine the optimum scope of work for the next maintenance outage based on the damage accumulated. Like many combined cycle plants, attemperators are typically a problem area. Through monitoring, however, it can be determined when temperature differential events occur and to what magnitude. Armed with this information aides in root cause investigation but also, if no damage is recorded, may extend the inspection interval.
HRSG DAMAGE TRACKING
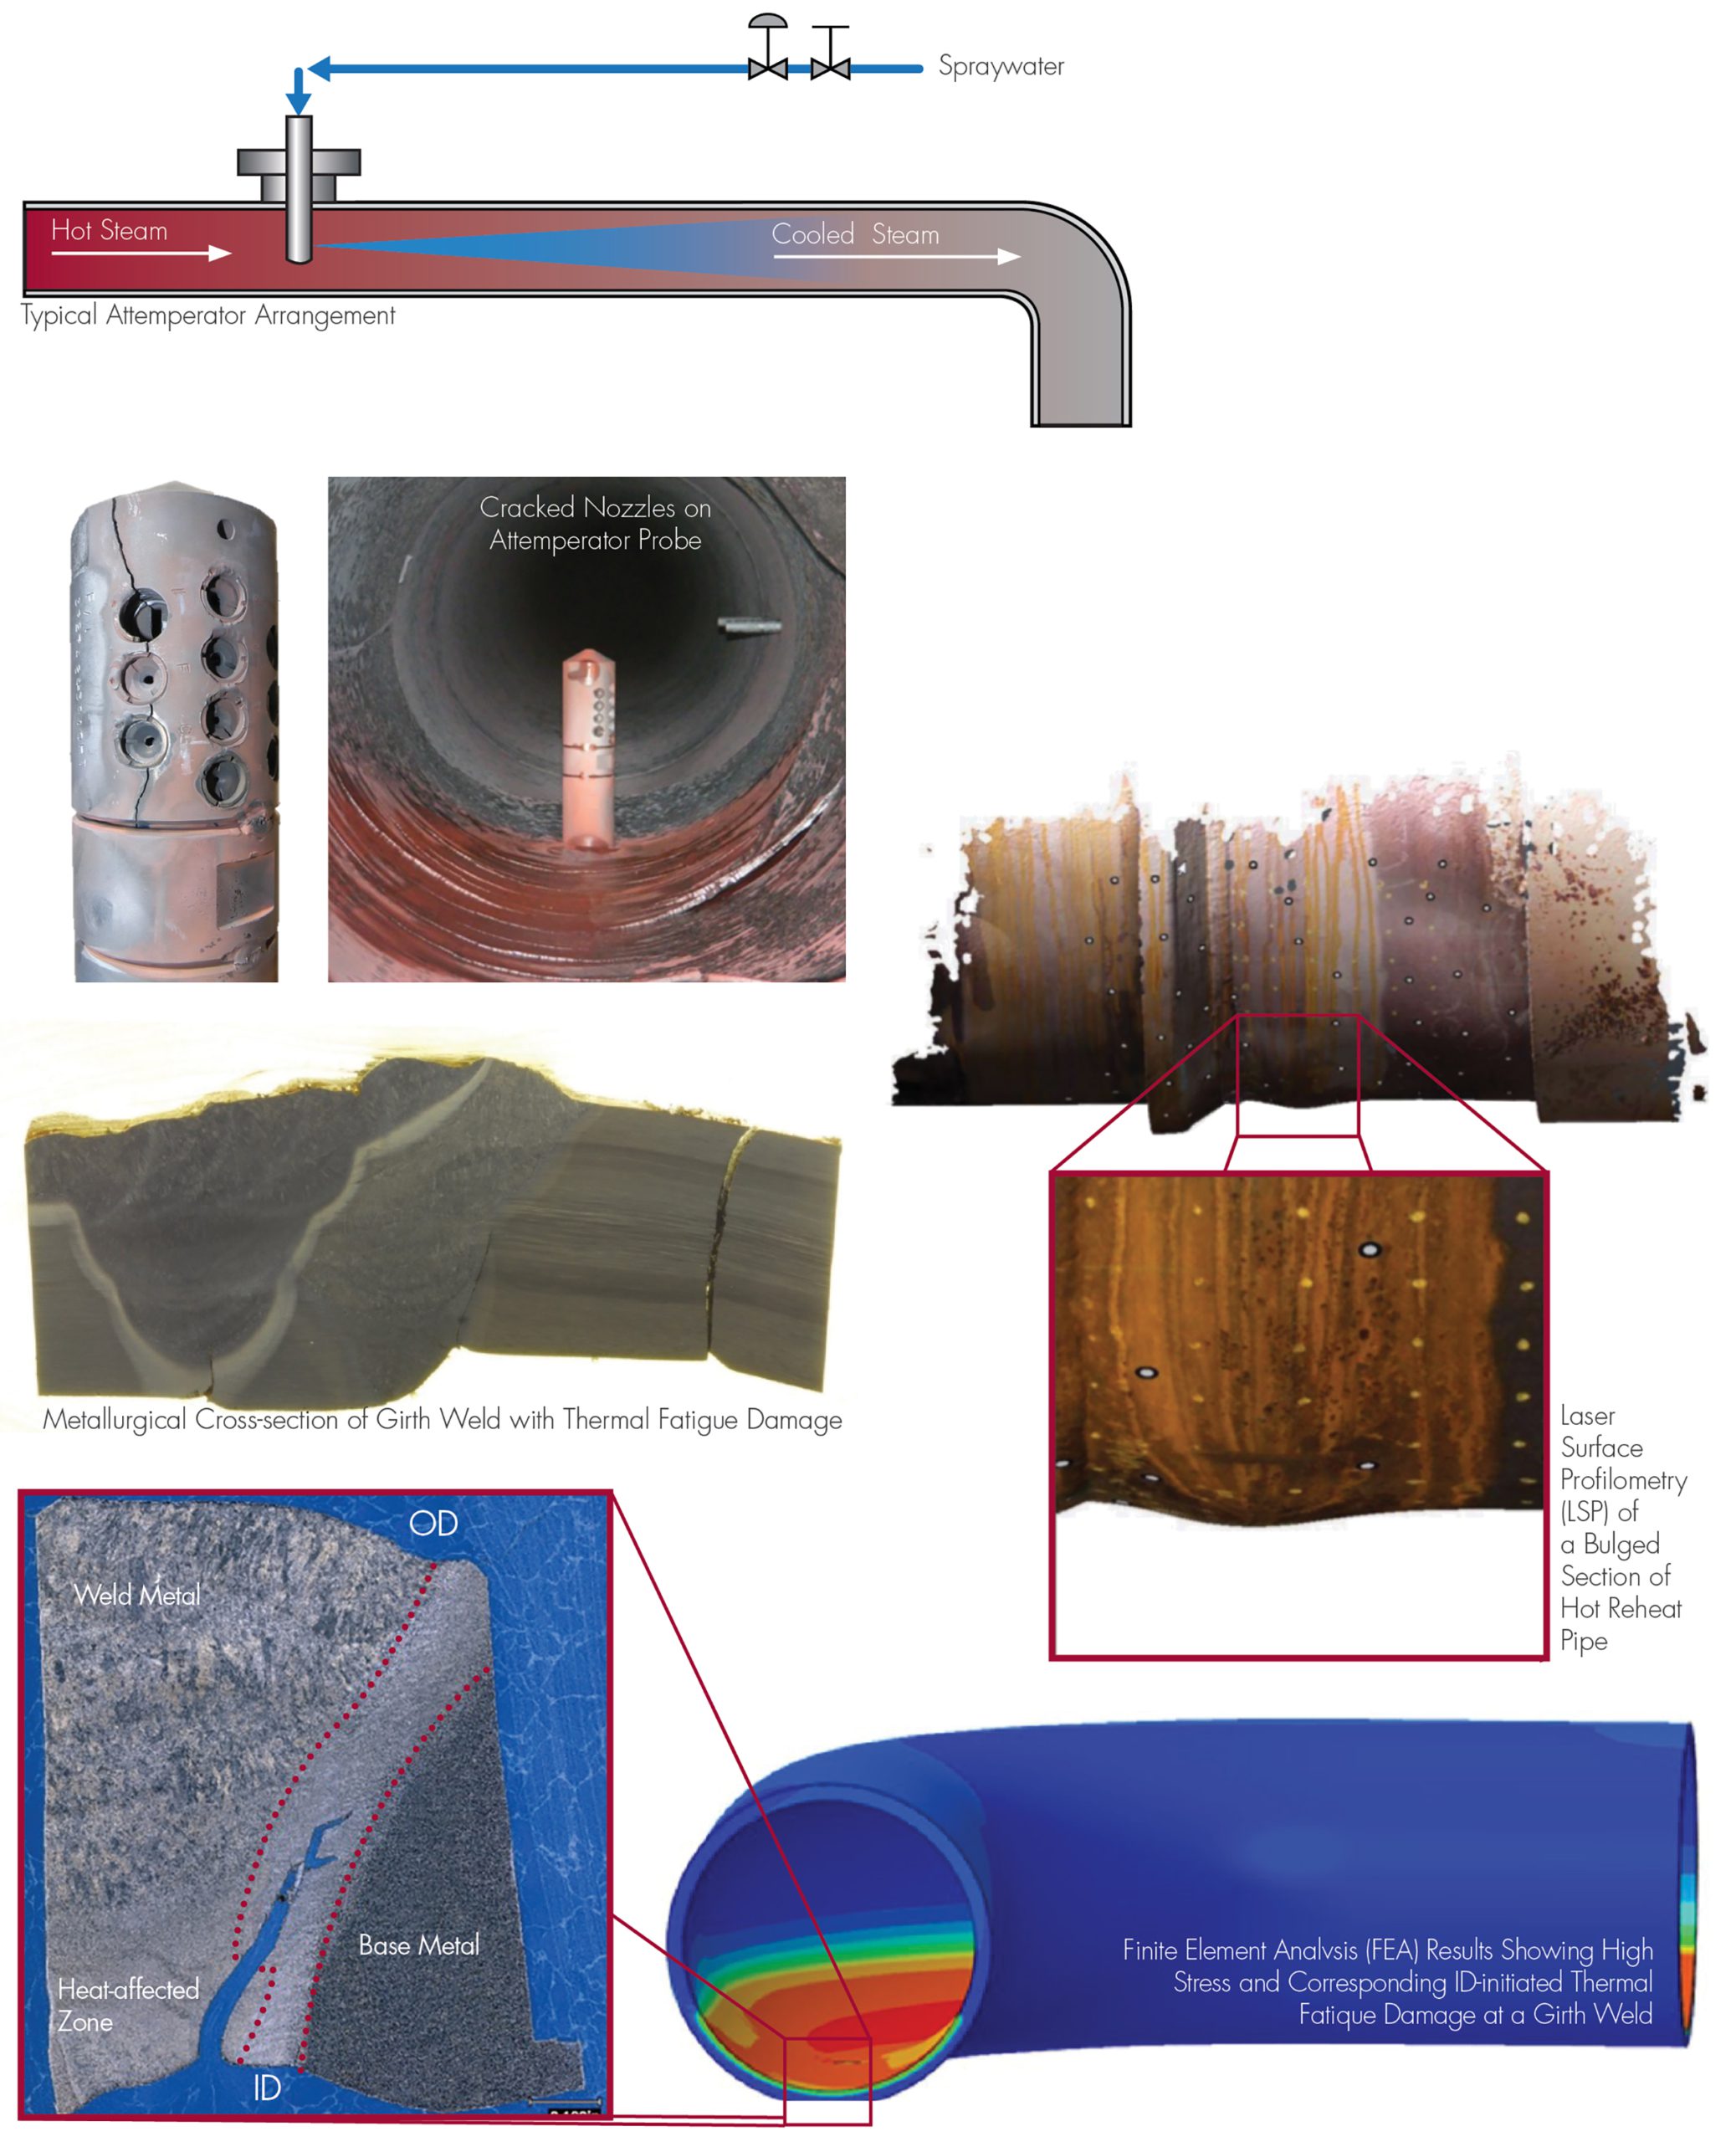
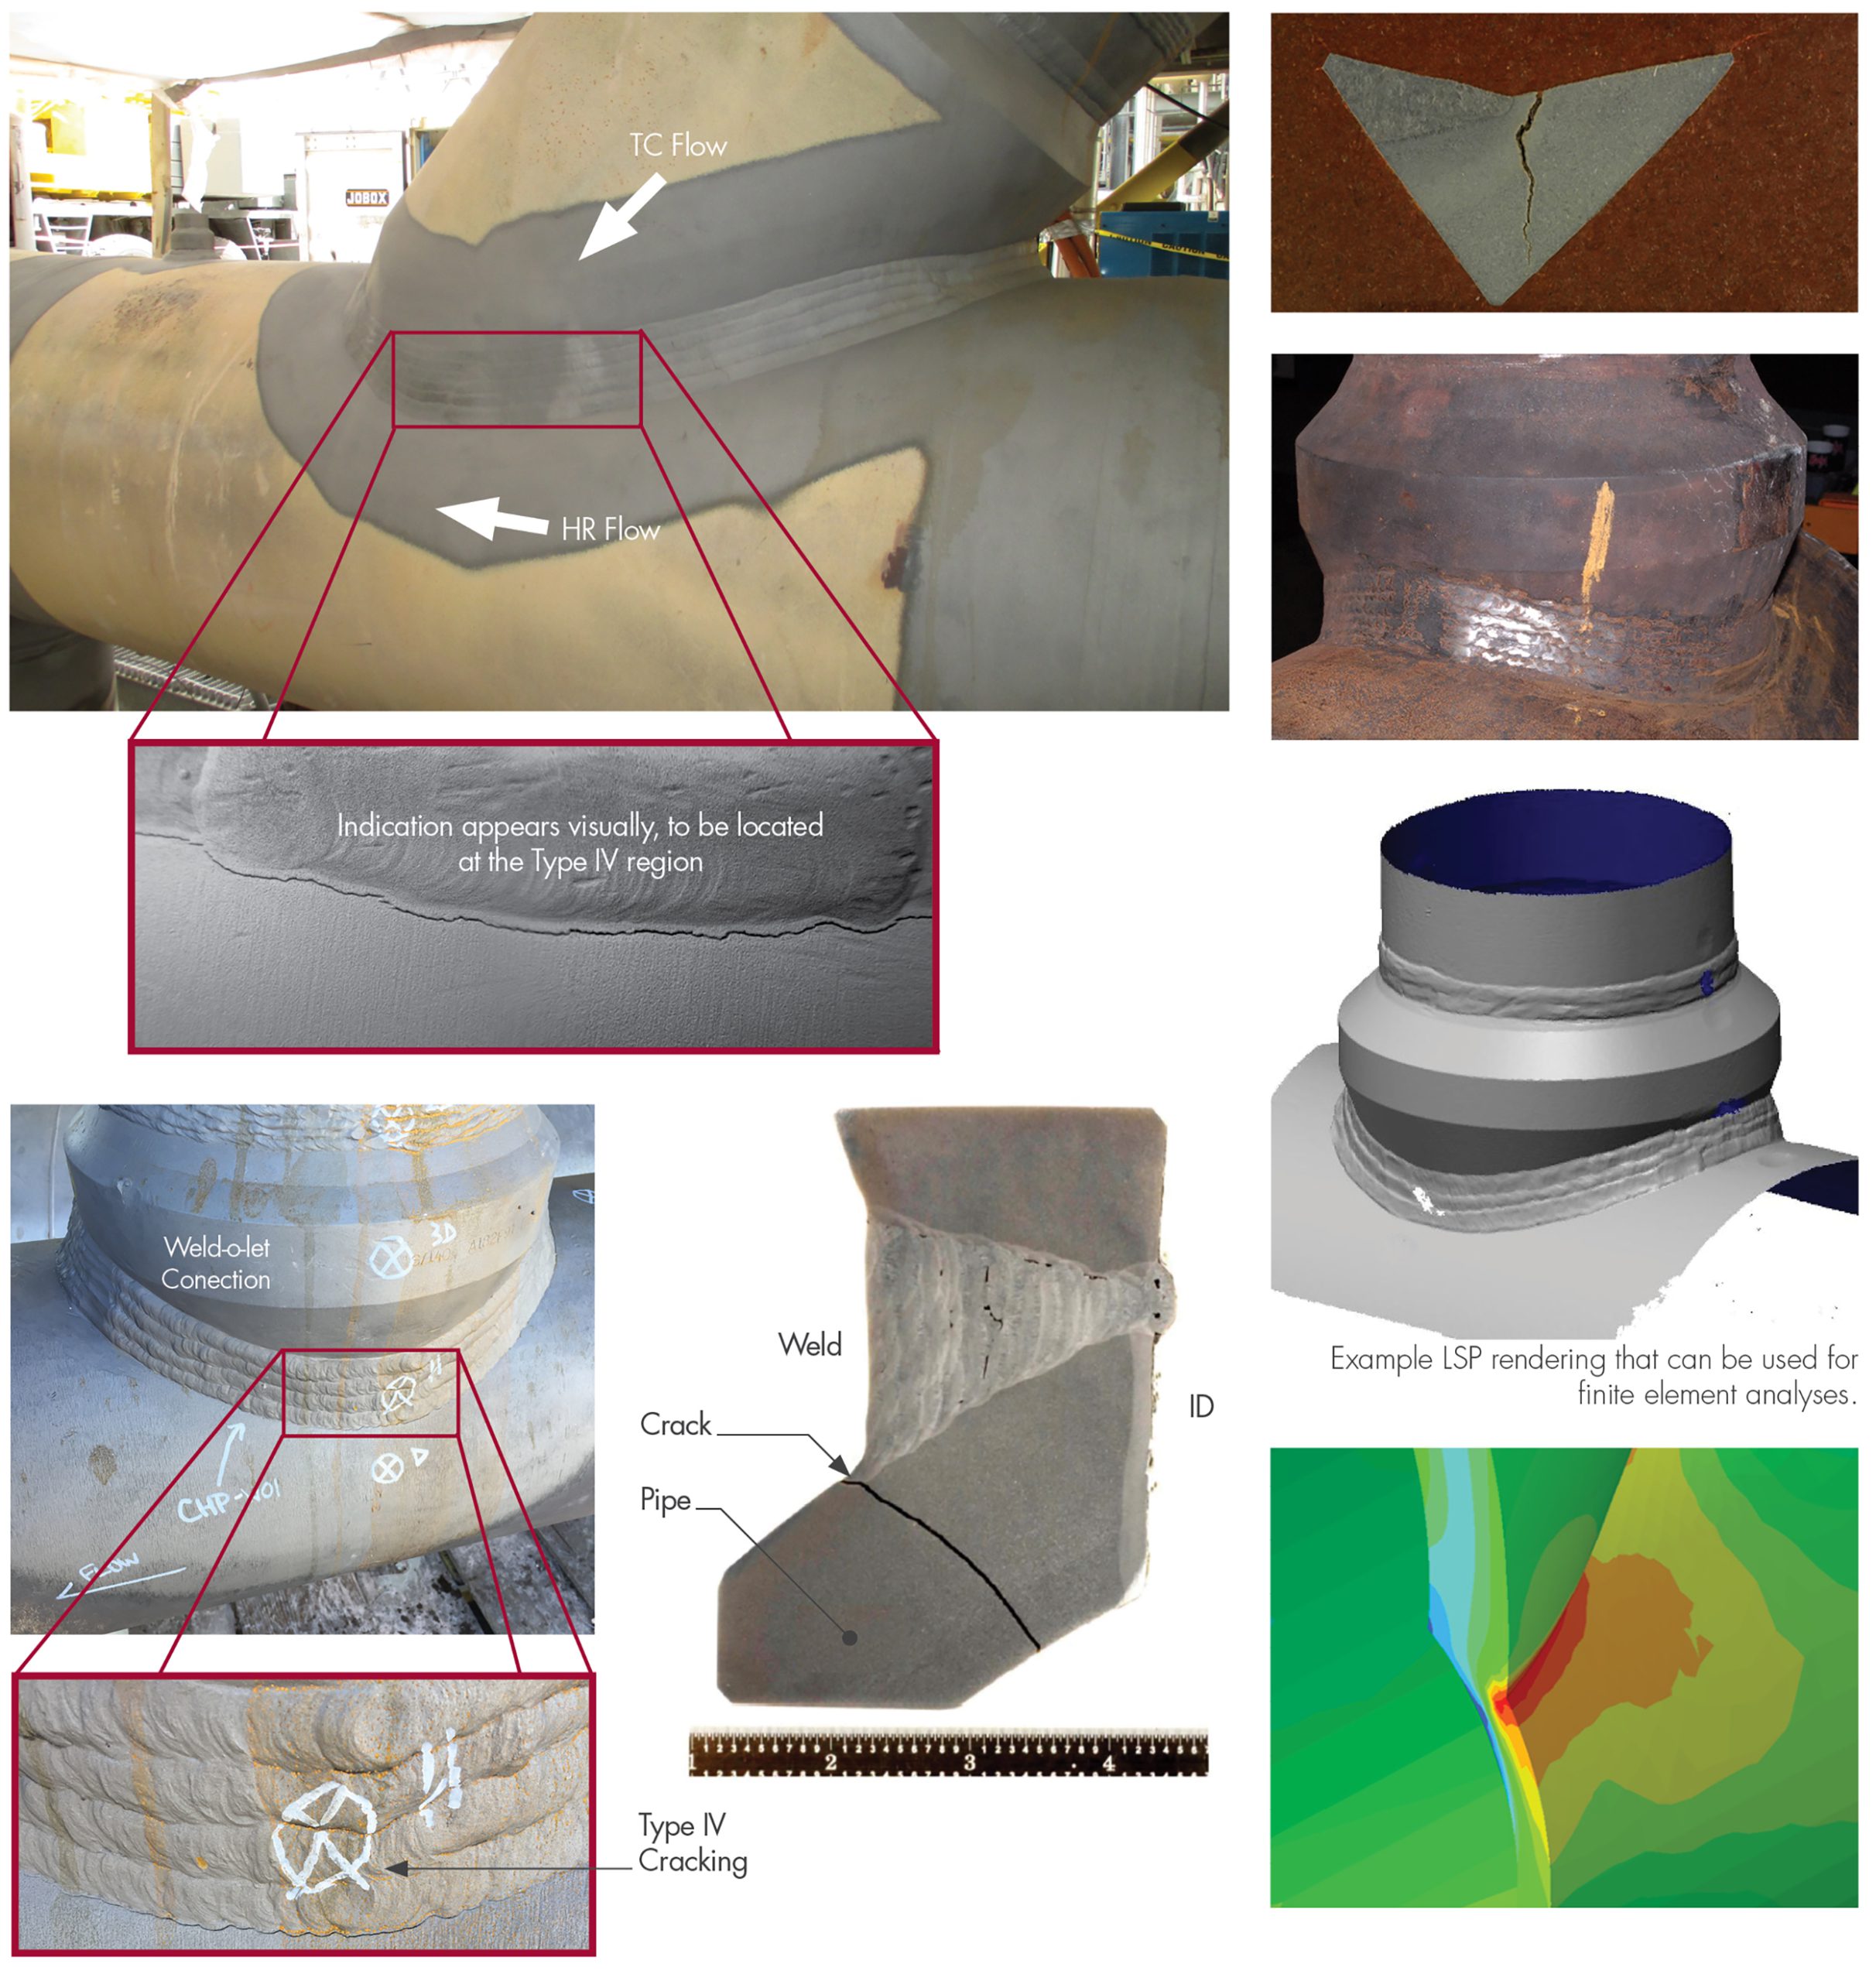
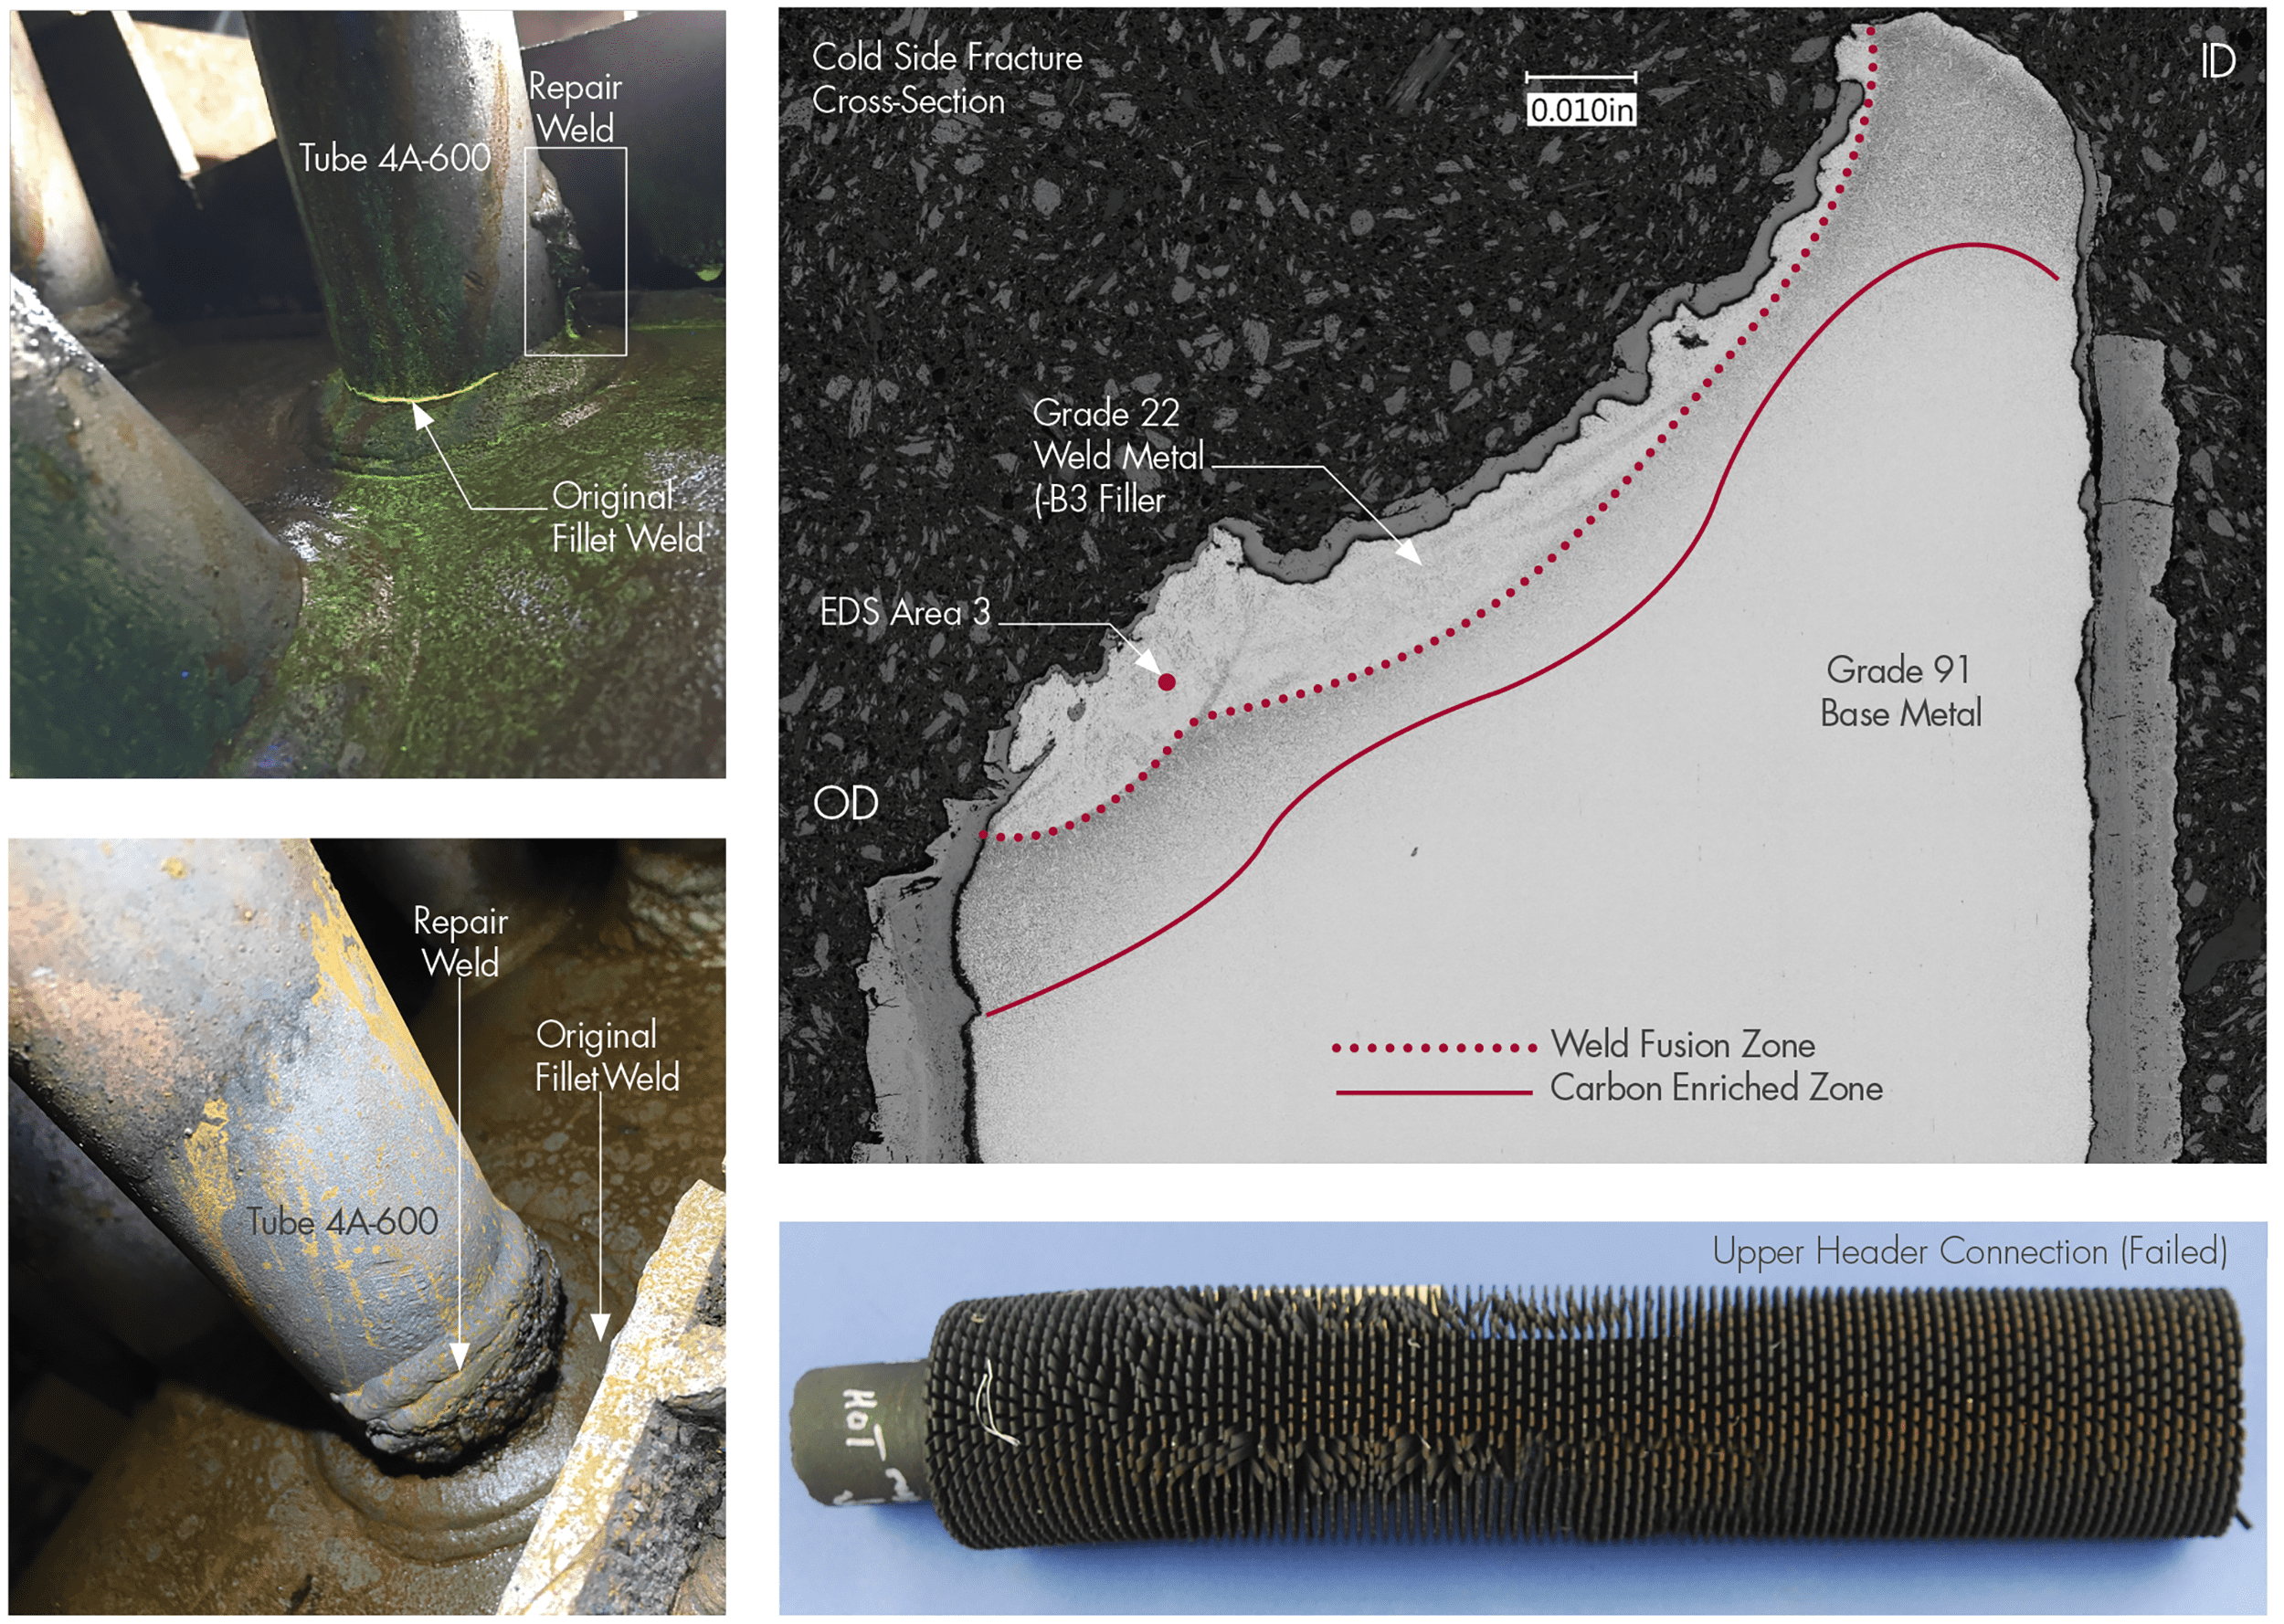
Many HRSG systems are susceptible to damage due to high temperatures and pressures as well as fluctuations and imbalances. Attemperators have been a leading cause of damage accumulation (fatigue) through improper design/operation of the spray water stations (Figure 5). In addition, periods of steady operation can result in accumulation of creep damage in header components (Figure 6) and unit cycling increases fatigue and creep-fatigue damage in stub/ terminal tubes and header ligaments (Figure 7). Monitoring the damage allows equipment owners to be proactive in mitigating or avoiding further damage.
Traditionally, periodic nondestructive examinations (NDE) would be used to determine the extent of damage, but in HRSGs this can be challenging due to access restraints and, in the case of the creep strength enhanced ferritic (CSEF) materials such as Grade 91, damage detection sensitivity is somewhat limited until near end of life. Continuous online monitoring and calculations of damage based on unit-specific finite element (FE) models (sometimes referred to as a ‘digital twin’) with live data addresses this issue.
Reliable life consumption estimates are made by applying SI’s algorithms for real-time creep and fatigue damage tracking, which use operating data, available information on material conditions, and actual component geometry.
SIIQ tracks trends in damage accumulation to intelligently guide life management decisions, such as the need for targeted inspections, or more detailed “off-line” analysis of anomalous conditions. This marks a quantum leap forward from decision making based on a schedule rather than on actual asset condition.
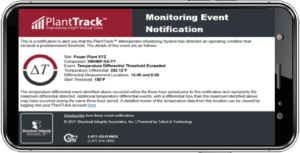
SIIQ can be configured to provide email alerts (Figure 7) when certain absolute damage levels are reached, or when a certain damage accumulation over a defined time frame is exceeded. In this way, the system can run hands-off in the background, and notify maintenance personnel when action might be required.
. . . To continue reading, please download the full issue.