

A CASE STUDY ON IMPLEMENTATION AT A 3X1 COMBINED CYCLE FACILITY (ARTICLE 1 OF 3)
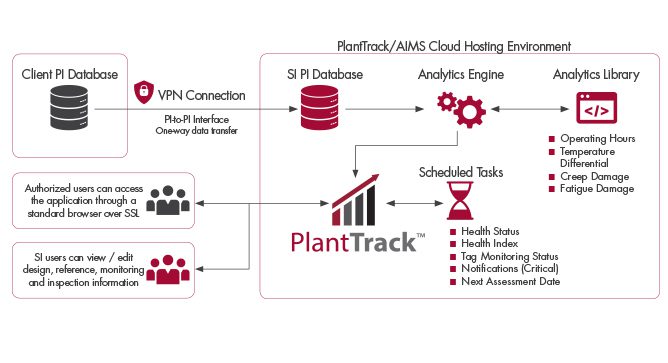
POWER PLANT ASSET MANAGEMENT SI’s technology differs from most systems by focusing on MODELING OF
Risk and Cost Reduction in Real Time Jason Van Velsor, Matt Freeman, Ben Ruchte Installed
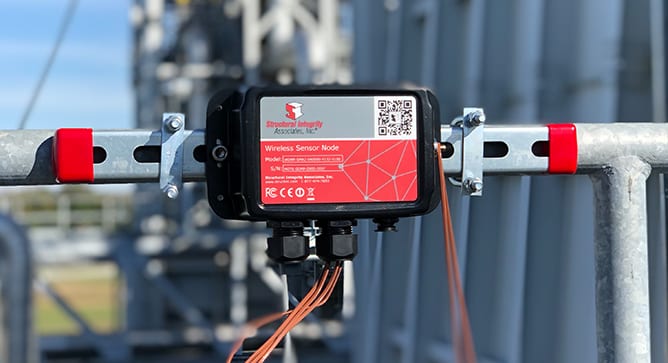
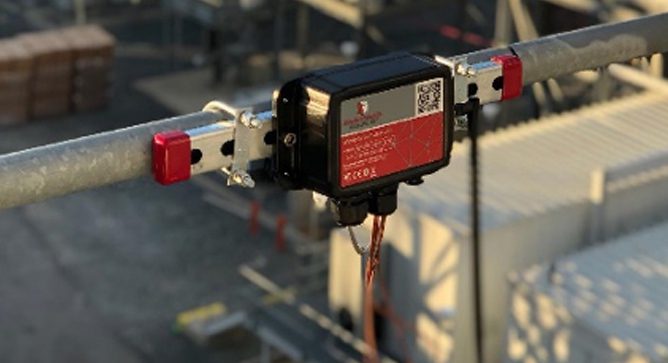
High Energy Piping Monitoring SI moves beyond the pilot application of a High Energy Piping
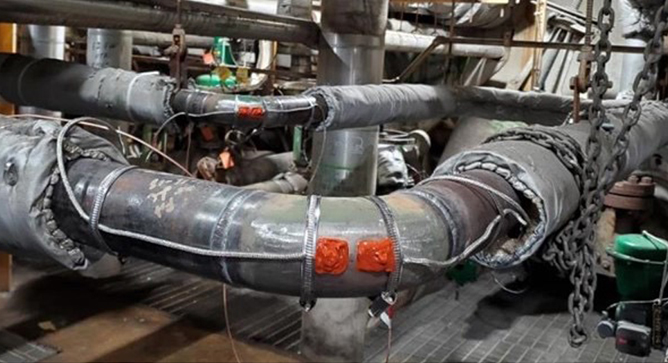
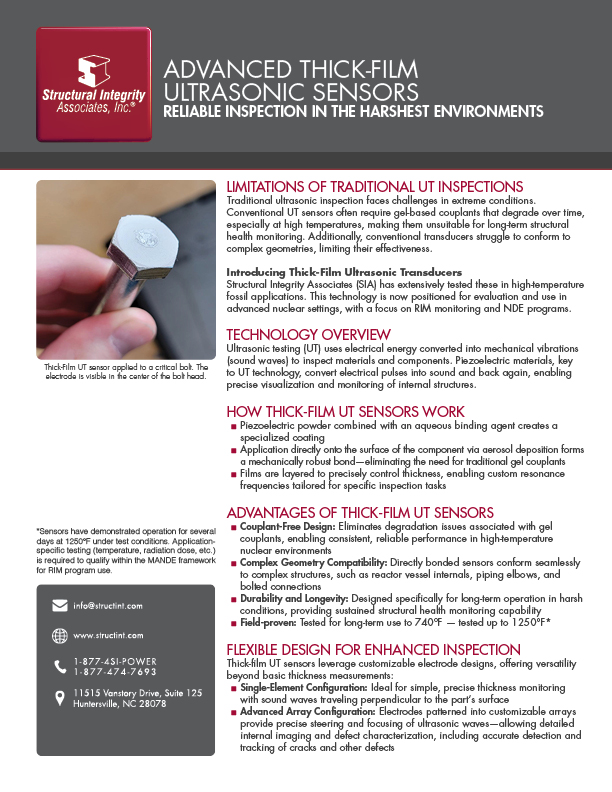
TECHNOLOGY INNOVATION – THICK FILM SENSORS By: Jason Van Velsor and Robert Chambers The ability
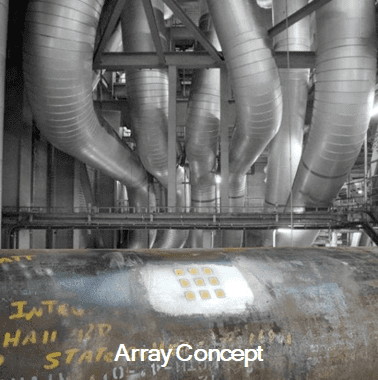
Jason Van Velsor, Robert Chambers The ability to continuously monitor component thickness at high temperatures