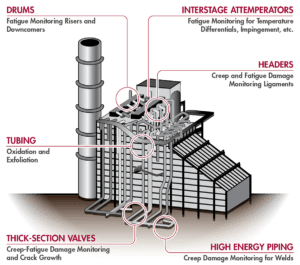
Figure 1. Typical components that are monitored with the pertinent damage mechanisms in mind.
A CASE STUDY ON IMPLEMENTATION AT A 3X1 COMBINED CYCLE FACILITY (ARTICLE 1 OF 3)
By: Kane Riggenbach and Ben Ruchte
SI has successfully implemented a real-time, online, damage monitoring system for the Heat Recovery Steam Generators (HRSGs) at a combined cycle plant with a 3×1 configuration (3 HRSGs providing steam to a single steam turbine).The system is configured to quantify and monitor the life limiting effects of creep and fatigue at select locations on each of the HRSGs (e.g. attemperators, headers, and drums – see Figure 1).The brand name for this system is SIIQ™, which exists as a monitoring solution for high energy piping (HEP) systems and/or HRSG pressure-part components.SIIQ™ utilizes off-the-shelf sensors (e.g. surface-mounted thermocouples) and existing instrumentation (e.g. thermowells, pressure taps, flow transmitters, etc.) via secure access to the data historian.The incorporation of this data into SI’s damage accumulation algorithms generates results that are then displayed within the online monitoring module of SI’s PlantTrack™ data management system (example of the dashboard display shown in Figure 2).
Figure 2. Example dashboard of the health status and ‘action’ date for a variety of components.
This article will be part of a series discussing items such as the background for monitoring, implementation/monitoring location selection, and future results for the 3×1 combined cycle plant.
Article 1 (current):Introduction to SIIQ™ with common locations for monitoring within HRSGs (and sections of HEP systems)
Article 2: Process of SIIQ™ implementation for the 3×1 facility with a discussion of the technical foundation for damage tracking
Article 3: Presentation of results from at least 6+ months, or another appropriate timeframe, of online monitoring data
BASIS FOR MONITORING The owner of the plant implemented the system with the desire of optimizing operations and maintenance expenses by reducing inspections or at least focusing inspections on the highest risk locations.The system has been in place for a few months now and is continuously updating risk ranking of the equipment and ‘action’ intervals.The ‘action’ recommended may be operational review, further analysis, or inspections.This information is now being used to determine the optimum scope of work for the next maintenance outage based on the damage accumulated.Like many combined cycle plants, attemperators are typically a problem area.Through monitoring, however, it can be determined when temperature differential events occur and to what magnitude.Armed with this information aides in root cause investigation but also, if no damage is recorded, may extend the inspection interval.
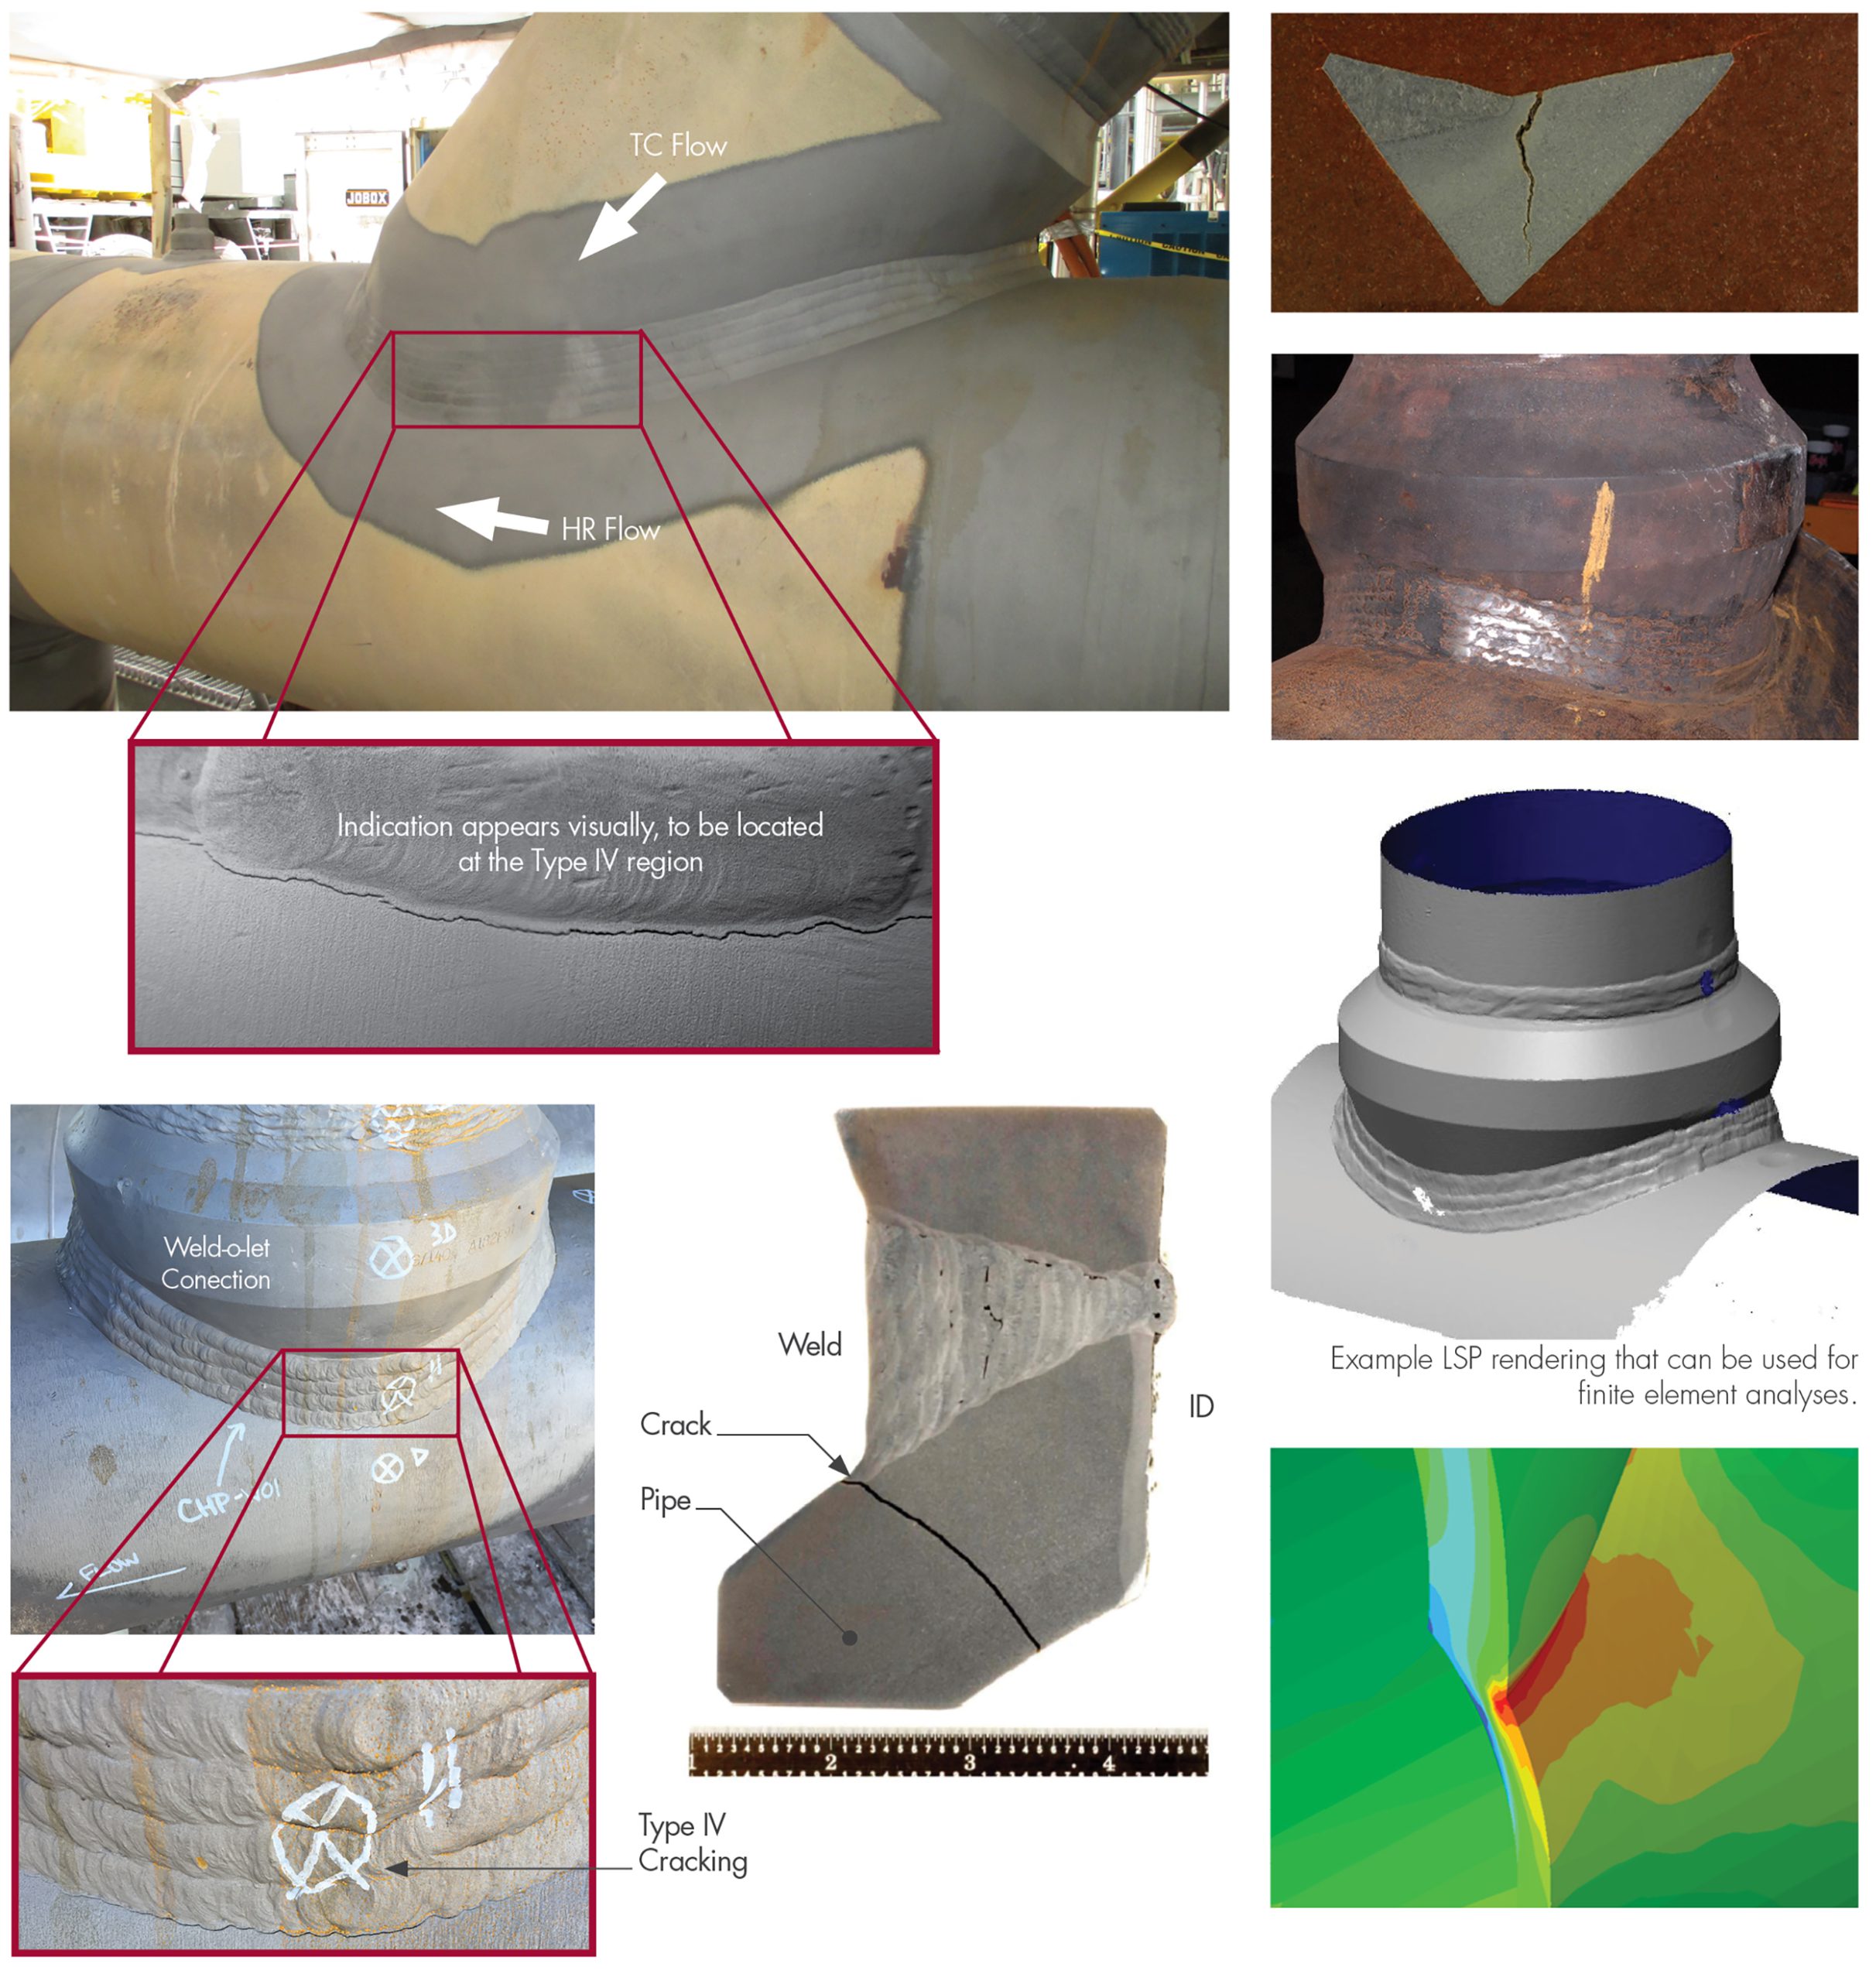
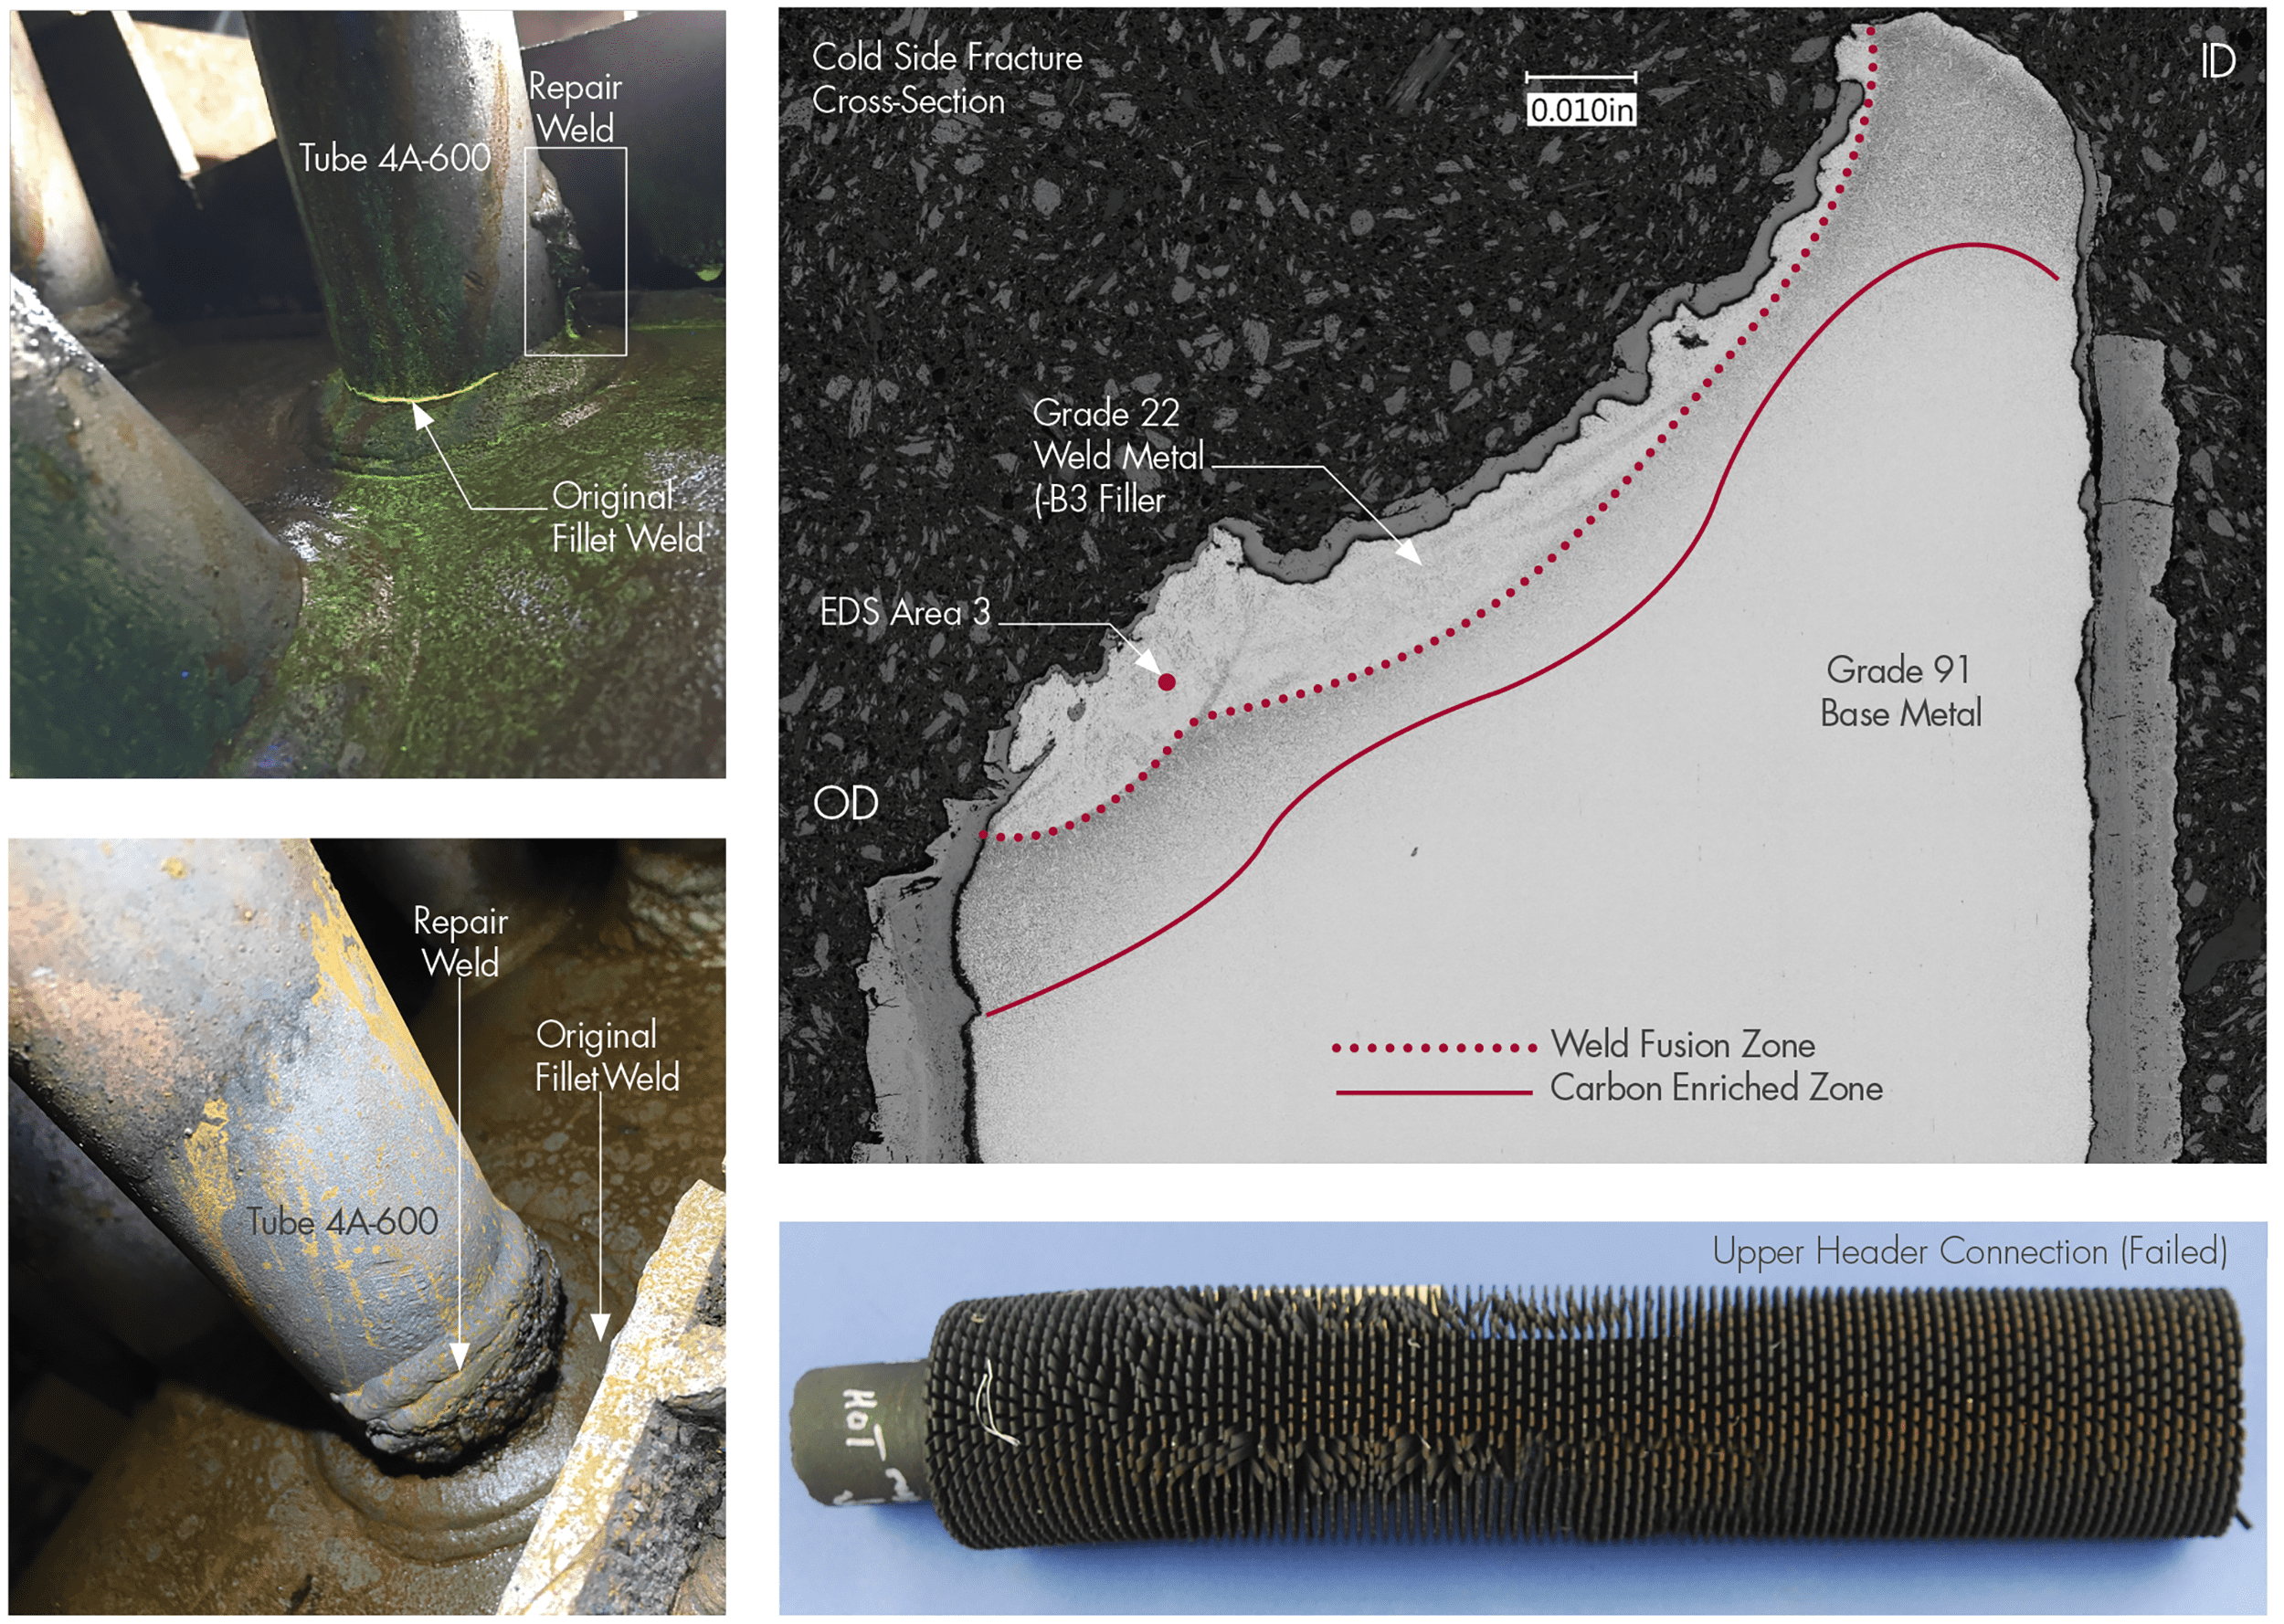
HRSG DAMAGE TRACKING Many HRSG systems are susceptible to damage due to high temperatures and pressures as well as fluctuations and imbalances.Attemperators have been a leading cause of damage accumulation (fatigue) through improper design/operation of the spray water stations (Figure 5).In addition, periods of steady operation can result in accumulation of creep damage in header components (Figure 6) and unit cycling increases fatigue and creep-fatigue damage in stub/ terminal tubes and header ligaments (Figure 7).Monitoring the damage allows equipment owners to be proactive in mitigating or avoiding further damage.
Traditionally, periodic nondestructive examinations (NDE) would be used to determine the extent of damage, but in HRSGs this can be challenging due to access restraints and, in the case of the creep strength enhanced ferritic (CSEF) materials such as Grade 91, damage detection sensitivity is somewhat limited until near end of life.Continuous online monitoring and calculations of damage based on unit-specific finite element (FE) models (sometimes referred to as a ‘digital twin’) with live data addresses this issue.
Figure 4. Examples of damage observed by SI on attemperators.
Reliable life consumption estimates are made by applying SI’s algorithms for real-time creep and fatigue damage tracking, which use operating data, available information on material conditions, and actual component geometry.
Figure 5. Examples of creep damage observed by SI on header link pipe connections (olets).
SIIQ tracks trends in damage accumulation to intelligently guide life management decisions, such as the need for targeted inspections, or more detailed “off-line” analysis of anomalous conditions. This marks a quantum leap forward from decision making based on a schedule rather than on actual asset condition.
Figure 6. Examples of creep/fatigue damage observed by SI at tube-to-header connections.
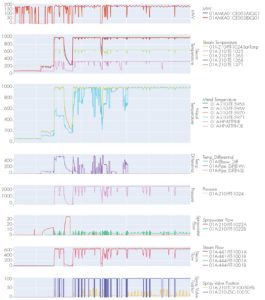
Figure 7. Examples of online monitoring alerts generated from SIIQ
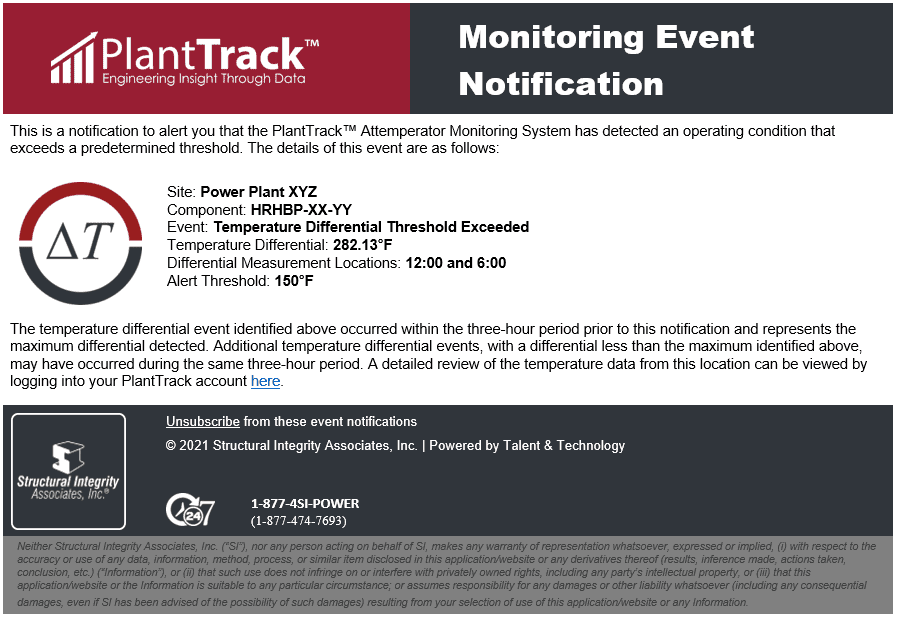
SIIQ can be configured to provide email alerts (Figure 7) when certain absolute damage levels are reached, or when a certain damage accumulation over a defined time frame is exceeded. In this way, the system can run hands-off in the background, and notify maintenance personnel when action might be required.
Installed sensors and continuous online monitoring are revolutionizing how power plants manage assets and risk by facilitating the transformation to condition-based maintenance routines. With access to near real-time data, condition assessments, and operating trends, operators have the opportunity to safely and intelligently reduce operations and maintenance costs and outage durations, maximize component lifecycles and uptime, and improve overall operating efficiency.
But not all data is created equal and determining what to monitor, where to monitor, selecting appropriate sensors, and determining data frequency are all critical decisions that impact data value. Furthermore, sensor procurement, installation services, data historian/storage, and data analysis are often provided by separate entities, which can lead to implementation challenges and disruptions to efficient data flow.
To provide our clients with a simplified implementation option that expedites the transition of data into intelligence, SI has developed SIIQ, a turnkey monitoring solution consisting of:
Assessing the most appropriate (e.g. highest risk) locations and method for monitoring
Multipurpose wireless sensor network
An independent data transmission infrastructure
PlantTrack™ visual database integration
Customizable automated alerts
Automated engineering insight
While there are many applications in which effective monitoring can be used to more efficiently manage the operation and maintenance of passive assets, such as high energy piping, attemperator management is one specific application that clearly demonstrates the value that can come from an effective monitoring program.
Industry Issue Attemperators (or desuperheaters), which reduce steam temperature using a water spray, are one of the most problematic components in combined cycle plants. There are several attemperator designs and configurations, but all are potentially vulnerable to damage. If the causes of damage are not addressed early, cracking and steam leaks can occur, leading to costly repairs and replacements. As is typically the case, currently installed data transmitters (pressure taps and thermowells) are located far downstream/upstream and cannot detect local transients that would suggest events like spraywater impingement, pooling, etc. The main challenge is that these events can lead to damage that often goes undetected until it is too late because the damaging temperature transients are not detected by standard plant control instrumentation. Without this local temperature data, it can be hard to predict when re-inspections/other mitigation steps should be pursued.
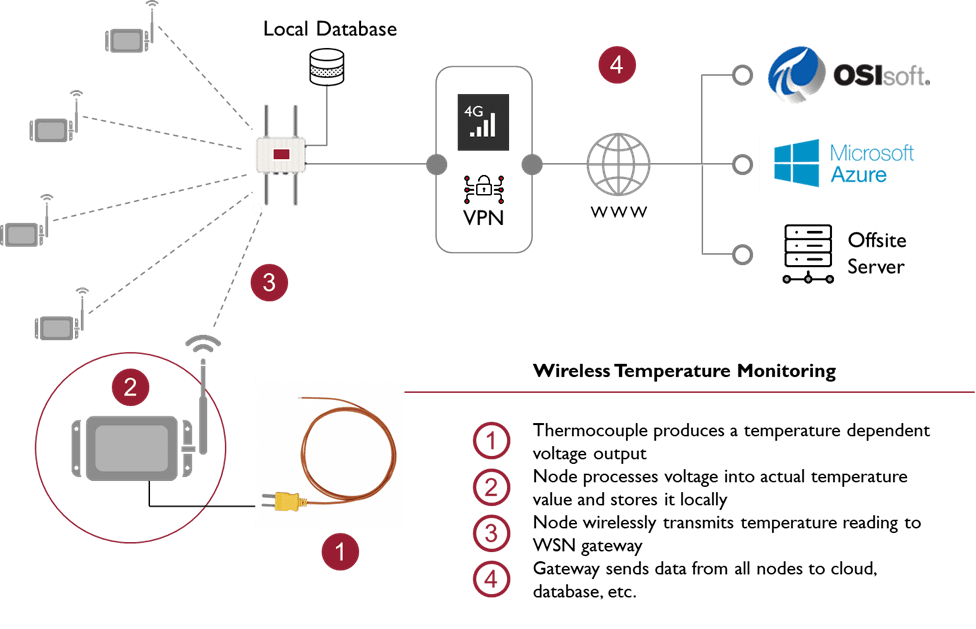
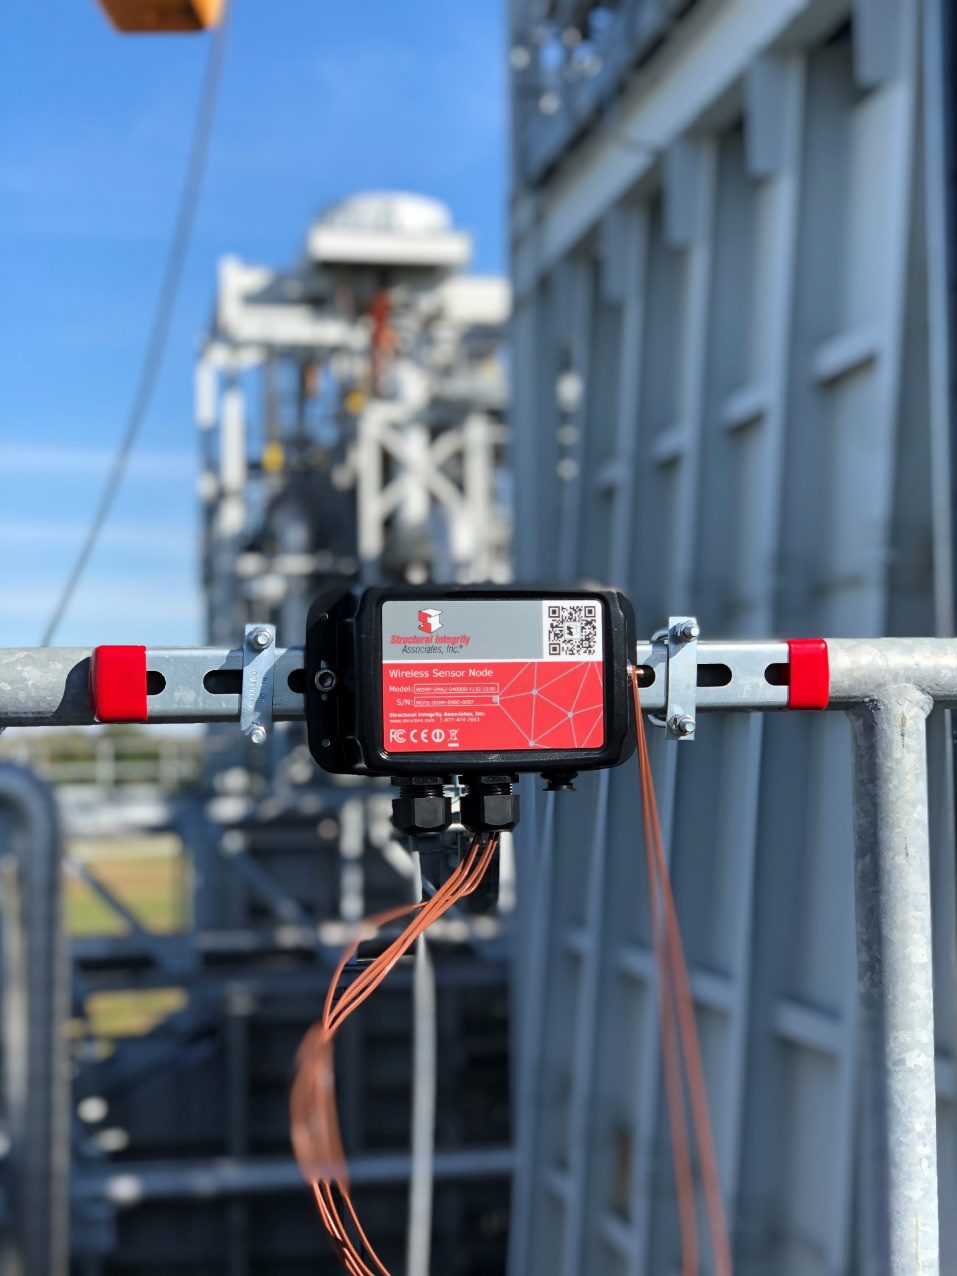
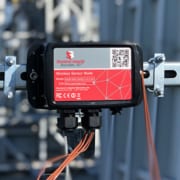
Monitoring Equipment/Capabilities To better characterize local temperature events and provide early indication of non-optimal attemperator operating conditions, SI offers a combination of software and hardware components that can be implemented with a range of services from monitoring, detecting, through diagnosing. At the root of these services is the need to collect data from locally installed thermocouples. While some plants chose to run the signal through the data historian and then transmit to SI for processing, an alternative is to use our wireless sensor network to collect and transmit data. SI’s wireless sensor network consists of two primary components: (1) a sensor node that collects the sensor data locally and transmits it wirelessly to (2) a gateway that transfers the data to the cloud.
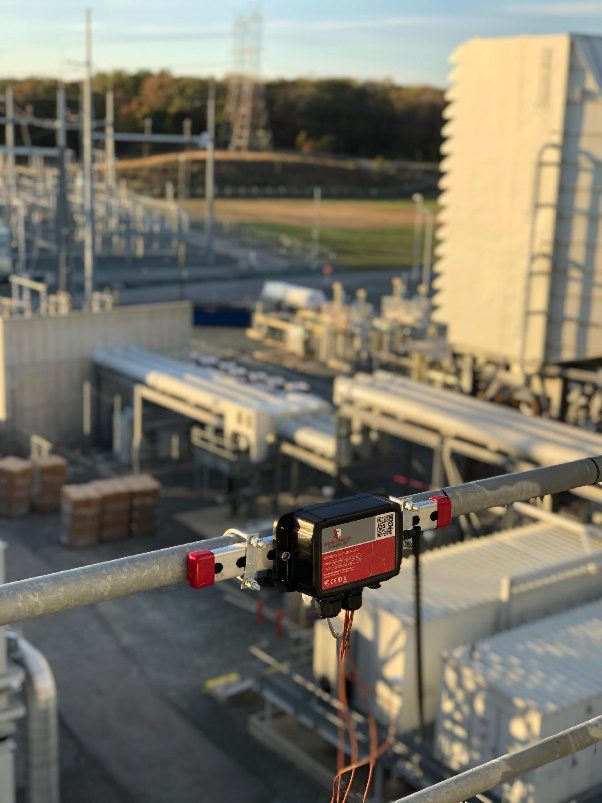
Figure 1 shows an image of SI’s data collection node, highlighting several of its features. Each node has multiple sensor channels and is capable of collecting data from a variety of sensor types. For the case of temperature monitoring, up to nine different standard thermocouples can be connected to a single node. Additionally, each node is battery powered and is available with an optional solar charging kit for outdoor installations. Furthermore, the data acquisitions nodes are weather-proof and designed to be installed in exposed locations.
As shown in Figure 2, the data acquisition node is installed locally and all thermocouples are hardwired to the node. The node then transmits the data wirelessly to the installed gateway using a proprietary 900MHz wireless protocol. The data collection and transmission frequency is adjustable based on the requirements of the application.
The data from all installed nodes are transmitted to a locally installed wifi/cellular-enabled gateway, which stores the data on a local database until the data is successfully transmitted to a cloud database. Serving as the edge connection to the web, the gateway can be configured to use a cellular network, eliminating the need to connect to any plant networks, or it can be configured with a plant-wide wifi network, if available and accessible. The location of the gateway enclosure is flexible as long as it is within ~1000 ft of all installed data collection nodes.
Figure 1 – Wireless data collection node.
SIIQ/PlantTrack App Once transmitted off-site, data can be accessed through SI’s PlantTrack software (part of the SIIQ. PlantTrack provides a suite of real-time event and damage tracking applications for common plant components: piping, headers, tubing, attemperators, etc. These applications interface to common DCS / Historian systems allowing for easy implementation, including review and analysis of historical data where that exists.
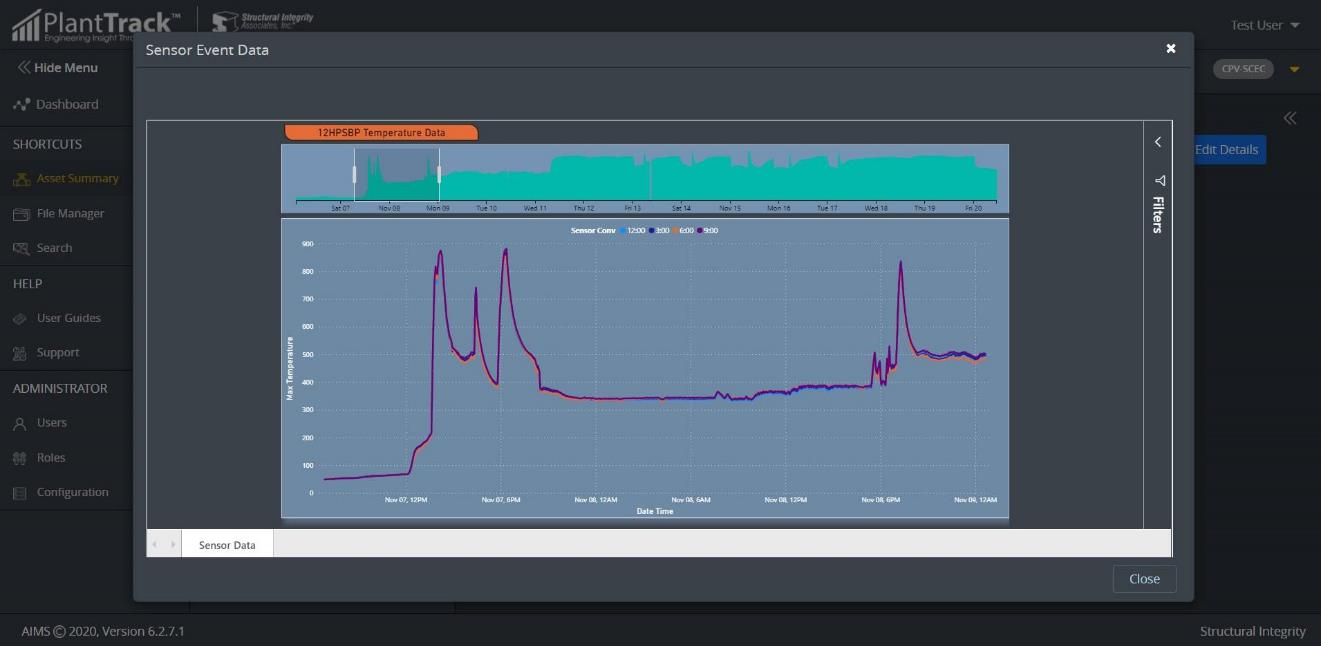
For Attemperator damage, tracking of temperature differentials with strategically placed TCs provides a means to quantify the number and accumulation of thermal transient events. The signals from the TCs are analyzed to log temperature differential events exceeding some threshold, providing valuable data that can be used to target inspections and plan outage scopes more efficiently. Our software can be configured to provide email alerts when certain magnitude events occur or based on trends in temperature events. Optionally, if PlantTrack Online is connected to the site data historian, SI can fully implement the PlantTrack Attemperator Damage Tracking module, which uses additional sensor data to aid in diagnosing and trending attemperator damage. Actual diagnoses and recommended remediation involves one of SI’s experts reviewing the data. This is made much easier with all the necessary data being compiled automatically within the PlantTrack system. Typical service includes reviewing the data on a periodic basis (e.g. quarterly) and providing a summary of damage events, likely causes, and recommended actions.
Figure 2 – Wireless sensor network configuration.
Figure 3 – Thermocouple data display in PlantTrack.
Figure 4 – Example automated email alert.
To provide some context, the following information provides two (2) case studies of continuous monitoring where some value was realized.
CASE 1: Bypass spray water stations (Maryland)
Finding: Noted variances in warm-up line functionality and changes to the circumferential temperature differentials/upshock and downshock of the piping.
A select combined cycle plant (2×1) recently experienced a through-wall leak at a girth weld on one of the HRSG’s hot reheat to condenser bypass line. A ring section containing the failed girth weld was removed and submitted to SI’s Materials Lab in Austin, Texas for review. The examination indicated that the crack was consistent with typical thermal fatigue damage, which is the expected damage mechanism for the area considering the proximity of a spray water station. SI recommended that the plant install local thermocouples (TCs) to assess the magnitude of transients experienced during load change events and normal operation – recommendation was made to instrument all 4 areas (2 hot reheat bypass, 2 high pressure bypass). SI also implemented our proprietary wireless sensor network where a node collects the TC data and transmits it wirelessly to a gateway that transfers the data to the cloud (Figure 5). Understanding the transients is the necessary first step, then evaluating/changing the logic, and follow-up with pertinent NDE inspections to ensure there is an understanding of the potential geometric factors here that could exacerbate any issue. If follow-on inspections find damage then the plant may also consider FEA/fracture mechanics to assess the timing of run/repair/replace options. It is also important to mention that the failed hot reheat bypass girth weld prompted the installation of a new spray water probe assembly to be completed at a later outage.
Figure 5 – SI’s wireless node at the select combined cycle facility that has TC sensors connected.
SI performed a high-level review of the TC data pre- and post-installation of this new spray water probe assembly during a particular outage and also examined all of the bypass location temperature data:
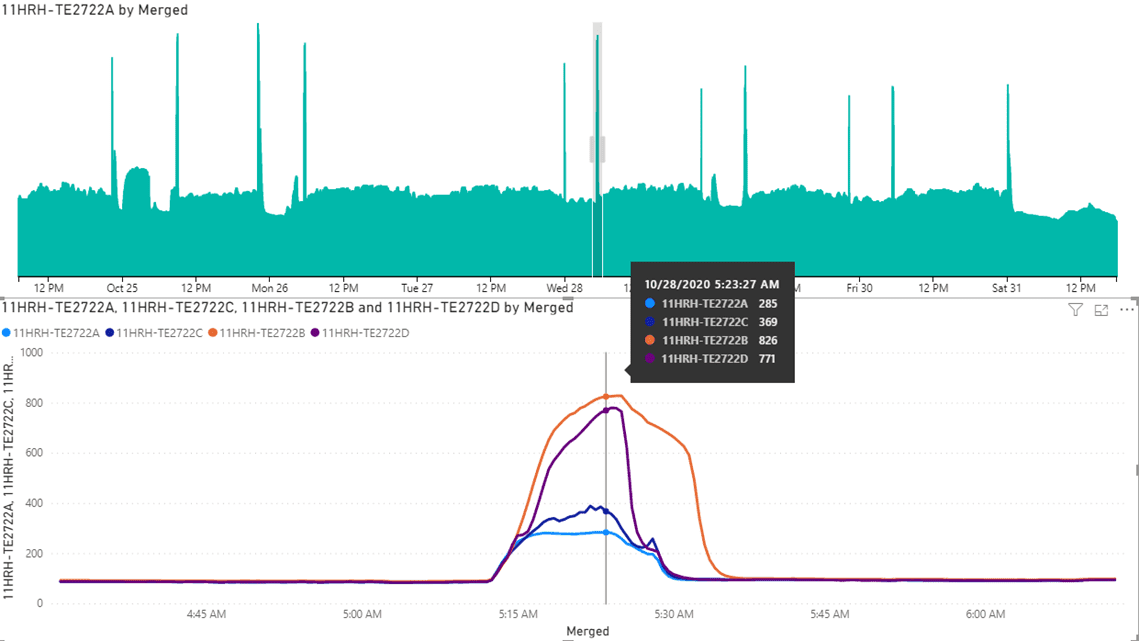
Pre-outage (data in Figure 6 shows 10/28/2020 @ ~5:20AM EST)
Warm-up line doesn’t appear to be operational – data is similar to post-outage data for the other hot reheat bypass line (has not failed)
Several ‘transient’ periods show steady rates of temperature change
Sides of the pipe – ambient to ~750-850F and back down to ambient over 20-30 min period
Top/bottom – ambient to ~275-400F and back down to ambient over 20-30 min period
>400-500F differentials around the circumference
Figure 6 – Pre-outage data for the hot reheat bypass system that experienced a failure.
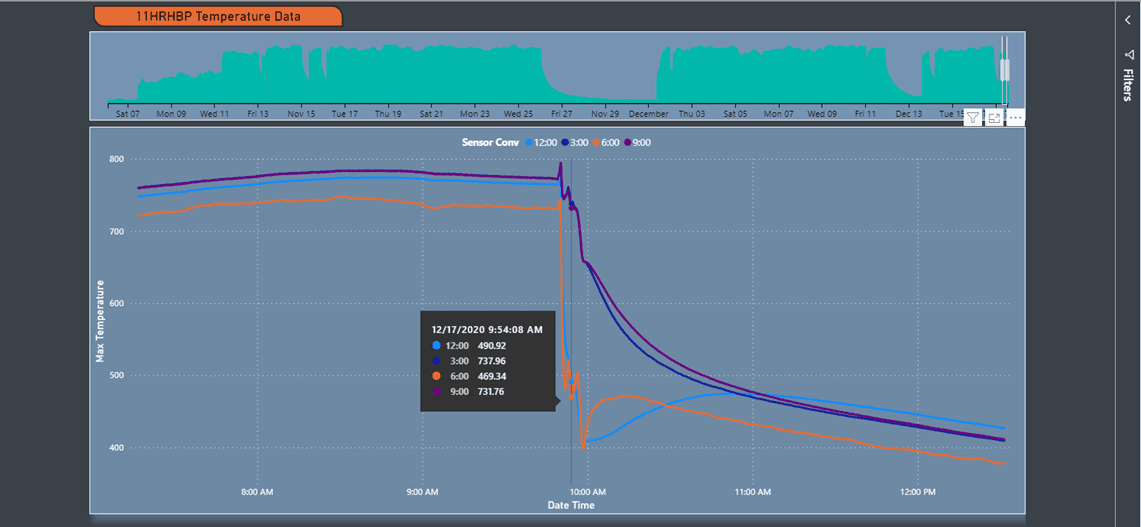
Post-outage (data in Figure 7 shows 12/17/2020 @ ~10:50AM EST)
Warm-up line appears to be operational – now differs from the other HRSG hot reheat bypass (warm-up line appears to be malfunctioning/not in operation)
Several ‘transient’ periods show much more prominent upshock and downshock (~275F/min in the plot below)
Sides of the pipe – steady from ~700-750F
Top/bottom – steady from ~700-750F, but then experience differentials after prominent upshocks and downshocks before settling out
>250-300F differentials around the circumference
Consensus on the pre- and post-outage data
Temperature differentials for the hot reheat bypass that failed appear to have improved from pre- to post-outage with a new probe assembly, but now with a functional warm-up line there are periods of more prominent temperature transients
Differentials around the circumference still exist
Spray nozzles can still be optimized
Figure 7 – Post-outage data for the hot reheat bypass system that experienced a failure.
CASE 2: Reheat interstage spray water stations (Texas)
Finding: Identified unevaporated spray water is present during cold starts and load changes. Resulting inspections identified prominent cracking of the piping in the vicinity of the spray water probe assembly.
A select combined cycle plant (2×1) has a reheat interstage line that was previously identified by plant personnel as having a prominent sag with the low point located near the desuperheater in 2017. A liner is indicated on the drawing, which should protect pipe ID surface from spraywater. However, SI performed a high-level operating data review and did some localized NDE of this region (January 2018).
This initial data review considered existing transmitters (pressure, temperature, valve positions, combustion turbine loads, etc.) and found that there is some indication that the reheater desuperheater spray control valve is not fully closed, or may be leaking under some conditions. A leaking spray water valve could contribute to pipe bowing as that would make the bottom of the pipe colder than the top. Normally, if the desuperheater piping is able to flex, then when it is cold on the bottom and hot on the top it will hog (bow up). If, however, the piping flex is constrained so it cannot hog, then the pipe remains horizontal and a significant tensile stress is developed in the bottom of the pipe. This causes the pipe to effectively “stretch” on the bottom so the bottom is longer, and over time this can lead to a bow down. During the warm start there are a few minutes where the desuperheater pipe is at or below saturation temperature, which could result in condensation in that line. There could also be spray water that has collected in the line prior to startup that takes some time to evaporate. In either case the result would be a top to bottom temperature difference in the pipe.
From the inspection side there were no major issues noted, but a recommendation was made to install surface-mounted thermocouples (TCs) at pertinent locations to assess the magnitude of thermal transients experienced during load change events and normal operation. Plant personnel installed 5 TCs (2 upstream of the liner/2 downstream of the liner at the top and bottom of the piping; 1 at the extrados of the downstream bend). Plant personnel routed the TC sensors to their data historian (PI) for continuous monitoring.
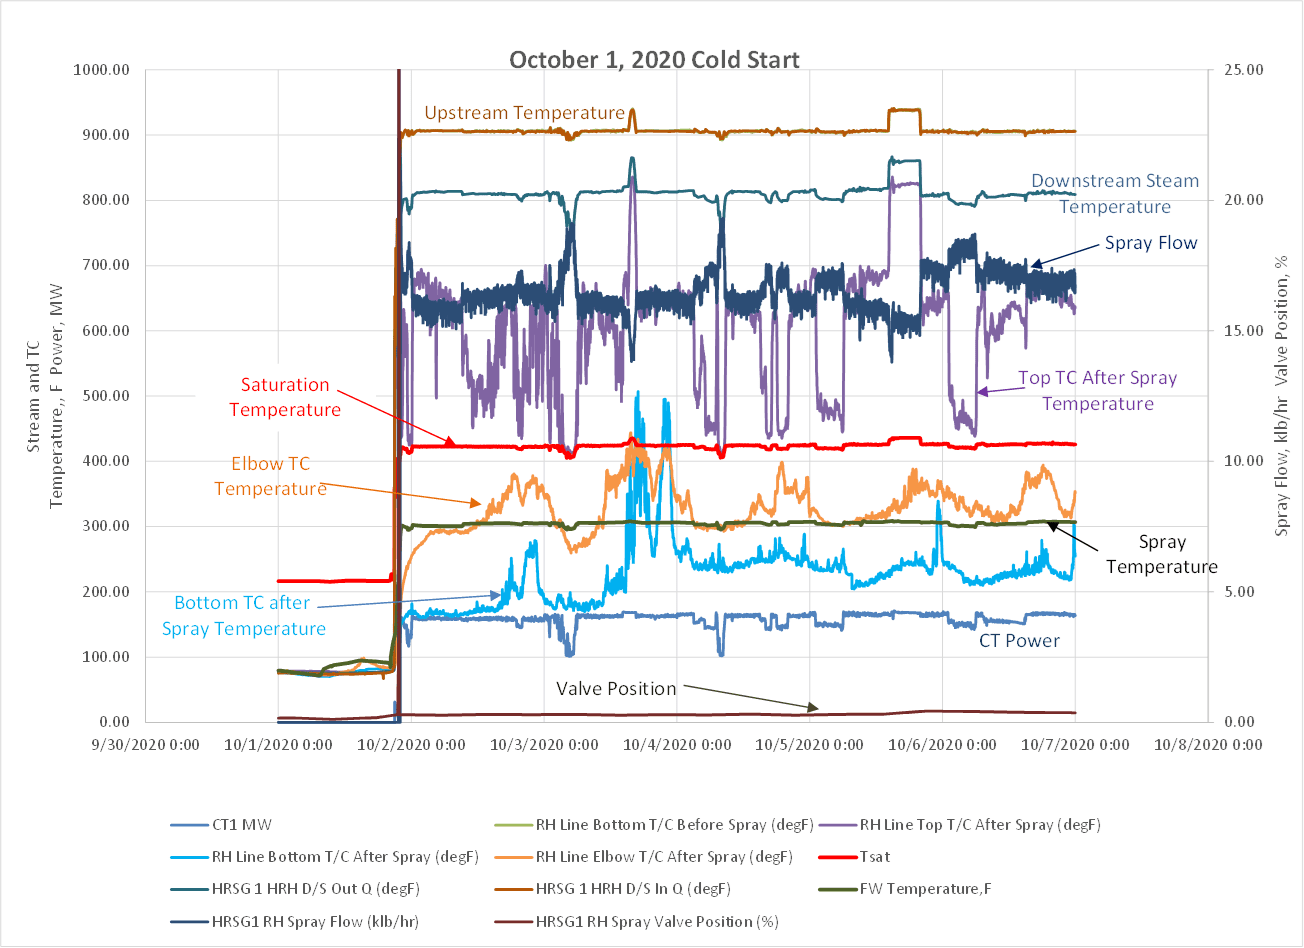
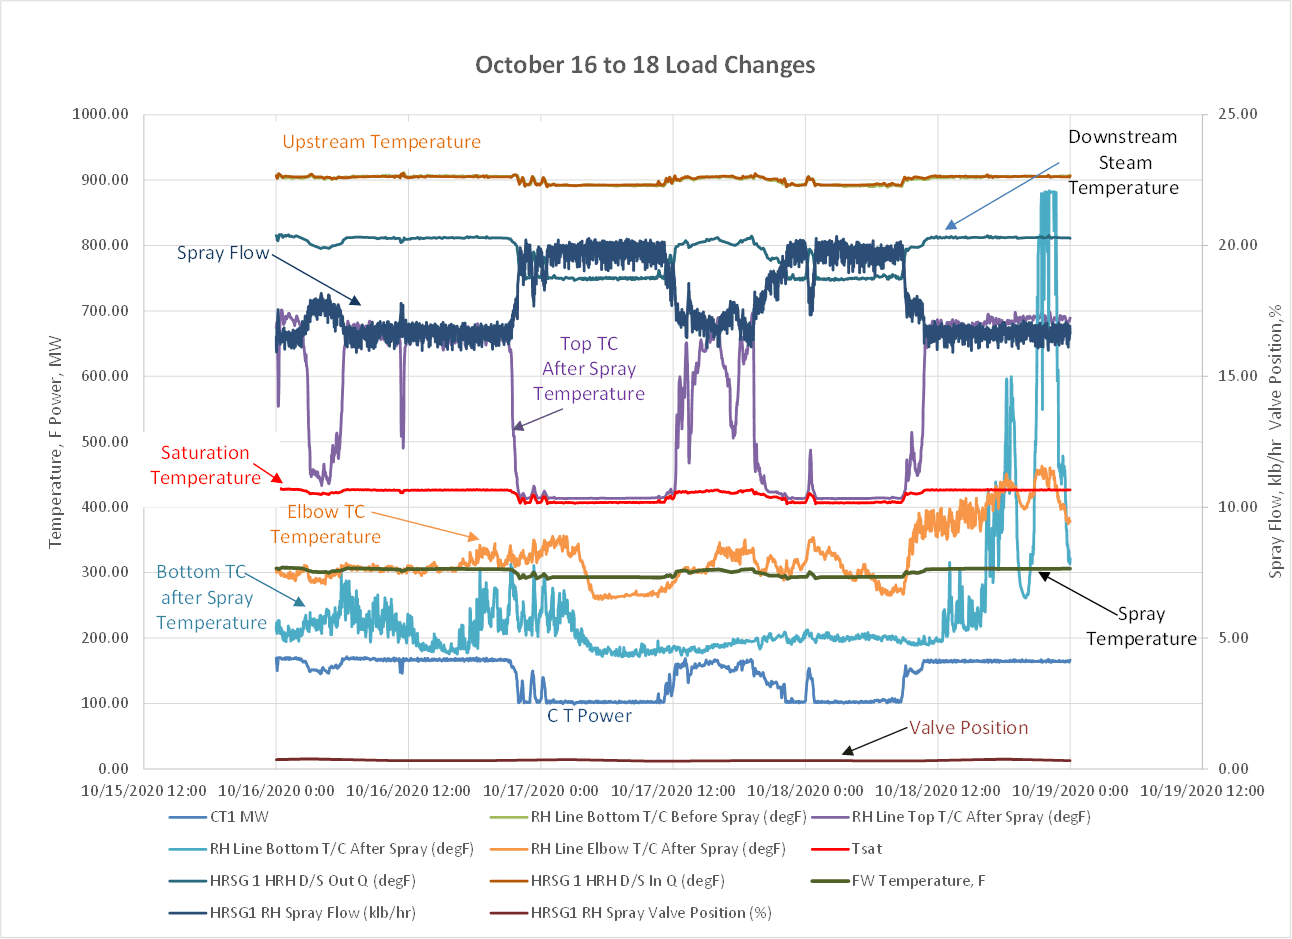
SI was then requested to perform a review of this second dataset to determine if there are problematic temperature differentials within this line (October 2020). The data indicated that during the cold start and at low load operation (Figure 8 and Figure 9), the spray flow is not fully mixed and saturated steam is impinging on the top of the pipe downstream of the spray. This prompted another inspection (January 2021) now that saturated steam was identified and also prompted a review of the liner/probe assembly port.
This particular inspection identified circumferential indications consistent with ID-initiated thermal fatigue noted within liner boundary. This damage started at the downstream side of nozzle port and continued axially for ~5’ before dissipating and was located from 10:00à2:00 (top circumference). The through-wall depths were prominent – through-wall failure and several other locations with 40%+ (some rough measurements of ~60-80% through-wall noted, as well). It appeared that possible condensate may be inadvertently leaking around the nozzle assembly and entering the reheat interstage line through the nozzle port/flanged connection – once it hits a little bit of steam flow in the line it may push this into the void between the liner and ID of the pipe.
In areas that were originally slated for inspection (exit of the liner, downstream extrados of the bend), no findings were noted. The unevaporated spraywater that was identified by the secondary data review is obviously not ideal, but damage development is driven by the magnitude of the temperature transient and the cycle count and does not appear to have manifested in service damage at this stage. Continuous monitoring is advisable.
Figure 8 – TC and existing transmitter data for a cold start that revealed unevaporated spray water in the reheat interstage line.
Figure 9 – TC and existing transmitter data for a load change that revealed unevaporated spray water in the reheat interstage line.
(Summary)
The crucial aspect in assessing the performance of these systems with spray water stations is being able to determine the magnitude and frequency of thermal transients. With the nearest temperature transmitters (thermoelements) typically located far downstream, local thermal transients at the conditioning valve and desuperheaters are often not detected. Surface-mounted thermocouples routed to the data historian/digital control system (DCS) or collected wirelessly help to evaluate temperature differentials around the pipe circumference and at geometrical impingement points. This, in conjunction with existing transmitters, allows for early detection of potentially damaging events so that appropriate mitigations (maintenance, logic updates, etc.) can be performed before costly repairs are required.
https://www.structint.com/wp-content/uploads/2022/05/Attemperator-Monitoring-with-Wireless-Sensors.jpg363668Structural Integrityhttps://www.structint.com/wp-content/uploads/2023/05/logo-name-4-930x191-1.pngStructural Integrity2022-05-12 13:04:102022-06-06 13:37:44Attemperator Monitoring with Wireless Sensors
SI moves beyond the pilot application of a High Energy Piping monitoring program designed to reduce operational risk and optimize maintenance activities.
SI has successfully implemented the initial application of an integrated monitoring solution that provides insight into damage evolution and operational risk using real-time data and automated engineering intelligence. This solution will assist in the optimization of maintenance activities and downtime, helping utilities get the most out of their O&M budgets. “This is a decisive step toward a more modern asset management approach that will lower O&M cost for our clients,” said Steve Gressler, Vice President, SI Energy Services Group, a division of Structural Integrity Associates, Inc. (SI) focused on power plant asset integrity.
Informed by decades of material performance knowledge, the SI team has refined a proprietary risk-ranking method to optimize sensor placement and deliver a high-value monitoring platform supported by the PlantTrack™ asset data management platform. The integration of monitoring information into the platform further enhances equipment asset integrity data to simplify stakeholder decision making. The SI solution incorporates various sensors working on a distributed wireless network to feed real-time data to SI’s state-of-the-art algorithms and is also capable of integrating with existing plant data historians to pull in other valuable operational data. The outcome is a cost-effective damage monitoring approach to focus resources and the timing of comprehensive field inspections.
“The architecture enables asset managers to obtain real-time feedback, alerts, and trends that clearly link actual operating conditions to the lifecycle of critical components.,” said Jason Van Velsor, Director of Integrated Monitoring Technology at SI.
“We have supported clients with asset integrity insights for decades and now offer enhanced monitoring technology that will help automate risk management for high energy piping and help obtain the most value out of field inspection and other maintenance activities during outages.”
Unique Features of the SI Solution include:
Design and application of a monitoring program that focuses on safety and reliability and is consistent with guidance contained in the ASME B31.1 regulatory code.
Expert assessment (or Gap Analysis) to optimize monitoring including health checkups to validate optimum monitoring for plant operation.
Decades of material analysis insights as algorithms to expertly inform decision making.
Customized automated alerts to notify operators of abnormal or undesirable operating conditions affecting the life of high-energy components.
The ability to continuously monitor component thickness at high temperatures has many benefits in the power generation industry, as well as many other industries. Most significantly, it enables condition-based inspection and maintenance, as opposed to schedule-based, which assists plant management optimizing operations and maintenance budgets and streamlining outage schedules. Furthermore, it can assist with the early identification of potential issues, which may be used to further optimize plant operations and provides ample time for contingency and repair planning.
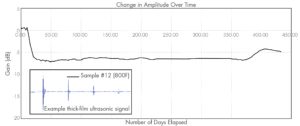
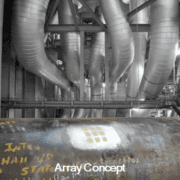
Over the last several years, Structural Integrity has been working on the development of a real-time thickness monitoring technology that utilizes robust, unobtrusive, ultrasonic thick-film sensor technology that is enabling continuous operation at temperatures up to 800°F. Figure 1 shows a photograph of an installed ultrasonic thick-film array, illustrating the low-profile, surface-conforming nature of the sensor technology. The current version of this sensor technology has been demonstrated to operate continuously for over two years at temperatures up to 800°F, as seen in the plot in Figure 2. These sensors are now offered as part of SI’s SIIQ™ intelligent monitoring system.
Figure 1 – Photograph of an ultrasonic thick-film array for monitoring wall-thickness over a critical area of a component.
Figure 2 – A plot of ultrasonic signal amplitude over time for a sensor operating continuously at an atmospheric and component temperature of 800°F.
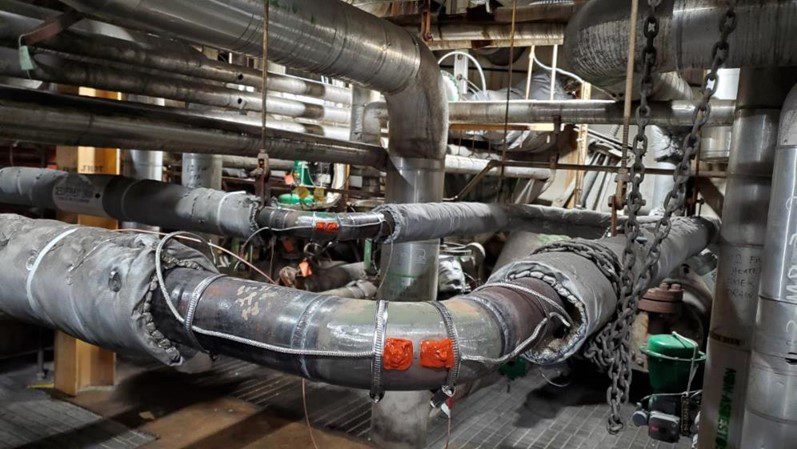
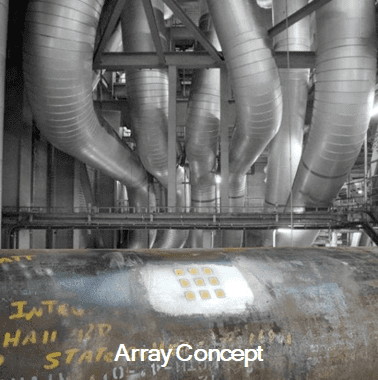
In addition to significant laboratory testing, the installation, performance, and longevity of Structural Integrity’s thick-film ultrasonic sensor technology has been demonstrated in actual operating power plant conditions, as seen in the photograph in Figure 3, where the sensors have been installed on multiple high-temperature piping components that are susceptible to wall thinning from erosion. In this application, the sensors are fabricated directly on the external surface of the pipe, covered with a protective coating, and then covered with the original piping insulation. Following installation, data can either be collected and transferred automatically using an installed data acquisition instrument, or a connection panel can be installed that permits users to periodically acquire data using a traditional off-the-shelf ultrasonic instrument.
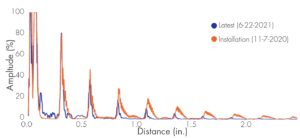
Figure 4 shows two sets of ultrasonic data that were acquired approximately eight months apart at an operating power plant. The first data set was acquired at the time of sensor installation and the second data set was acquired after approximately eight months of typical cycling, with temperatures reaching up to ~500°F. Based on the observed change in the time-of-flight between the multiple backwall echoes observed in the signals, it is possible to determine that there has been approximately 0.005 inches of wall loss over the 8-month period. Accurately quantifying such as small loss in wall thickness can often provide meaningful insight into plant operations and processes, can provide an early indication of possible issues, and is only possible when using installed sensors.
Other potential applications of Structural Integrity’s ultrasonic thick-film sensor technology include the following:
Real-time thickness monitoring
Flow Accelerated Corrosion (FAC)
Erosion / Corrosion
Crack Monitoring
Real-time PAUT
Full Matrix Capture
Critical Area Monitoring
Other Applications
Bolt Monitoring
Guided Wave Monitoring
In addition to novel sensor technologies to generate data, Structural Integrity offers customizable asset integrity management solutions, as part of the SIIQ platform, such as PlantTrackª, for storing and managing critical data. Many of these solutions are able to connect with plant historians to gather additional data that feed our engineering-based analytical algorithms, which assist in converting data into actionable information regarding plant assets. These algorithms are based on decades of engineering consulting and assessment experience in the power generation industry.
Reach out to one of our NDE experts to learn more about SI’s cutting-edge thick-film UT technology.
Figure 3 – Photograph showing Structural Integrity’s thick-film ultrasonic sensor technology installed on two high-temperature piping elbows that are susceptible to thinning from erosion.
Figure 4 – Ultrasonic waveforms acquired approximately 8 months apart showing 0.005 inches of wall loss at the sensor location over this period.
https://www.structint.com/wp-content/uploads/2022/05/word-image-14.png380378Structural Integrityhttps://www.structint.com/wp-content/uploads/2023/05/logo-name-4-930x191-1.pngStructural Integrity2022-04-19 14:49:002022-05-13 16:53:32High Temperature Ultrasonic Thickness Monitoring
We may request cookies to be set on your device. We use cookies to let us know when you visit our websites, how you interact with us, to enrich your user experience, and to customize your relationship with our website.
Click on the different category headings to find out more. You can also change some of your preferences. Note that blocking some types of cookies may impact your experience on our websites and the services we are able to offer.
Essential Website Cookies
These cookies are strictly necessary to provide you with services available through our website and to use some of its features.
Because these cookies are strictly necessary to deliver the website, refusing them will have impact how our site functions. You always can block or delete cookies by changing your browser settings and force blocking all cookies on this website. But this will always prompt you to accept/refuse cookies when revisiting our site.
We fully respect if you want to refuse cookies but to avoid asking you again and again kindly allow us to store a cookie for that. You are free to opt out any time or opt in for other cookies to get a better experience. If you refuse cookies we will remove all set cookies in our domain.
We provide you with a list of stored cookies on your computer in our domain so you can check what we stored. Due to security reasons we are not able to show or modify cookies from other domains. You can check these in your browser security settings.
Google Analytics Cookies
These cookies collect information that is used either in aggregate form to help us understand how our website is being used or how effective our marketing campaigns are, or to help us customize our website and application for you in order to enhance your experience.
If you do not want that we track your visit to our site you can disable tracking in your browser here:
Other external services
We also use different external services like Google Webfonts, Google Maps, and external Video providers. Since these providers may collect personal data like your IP address we allow you to block them here. Please be aware that this might heavily reduce the functionality and appearance of our site. Changes will take effect once you reload the page.
Google Webfont Settings:
Google Map Settings:
Google reCaptcha Settings:
Vimeo and Youtube video embeds:
Other cookies
The following cookies are also needed - You can choose if you want to allow them:
Privacy Policy
You can read about our cookies and privacy settings in detail on our Privacy Policy Page.


 BASIS FOR MONITORING
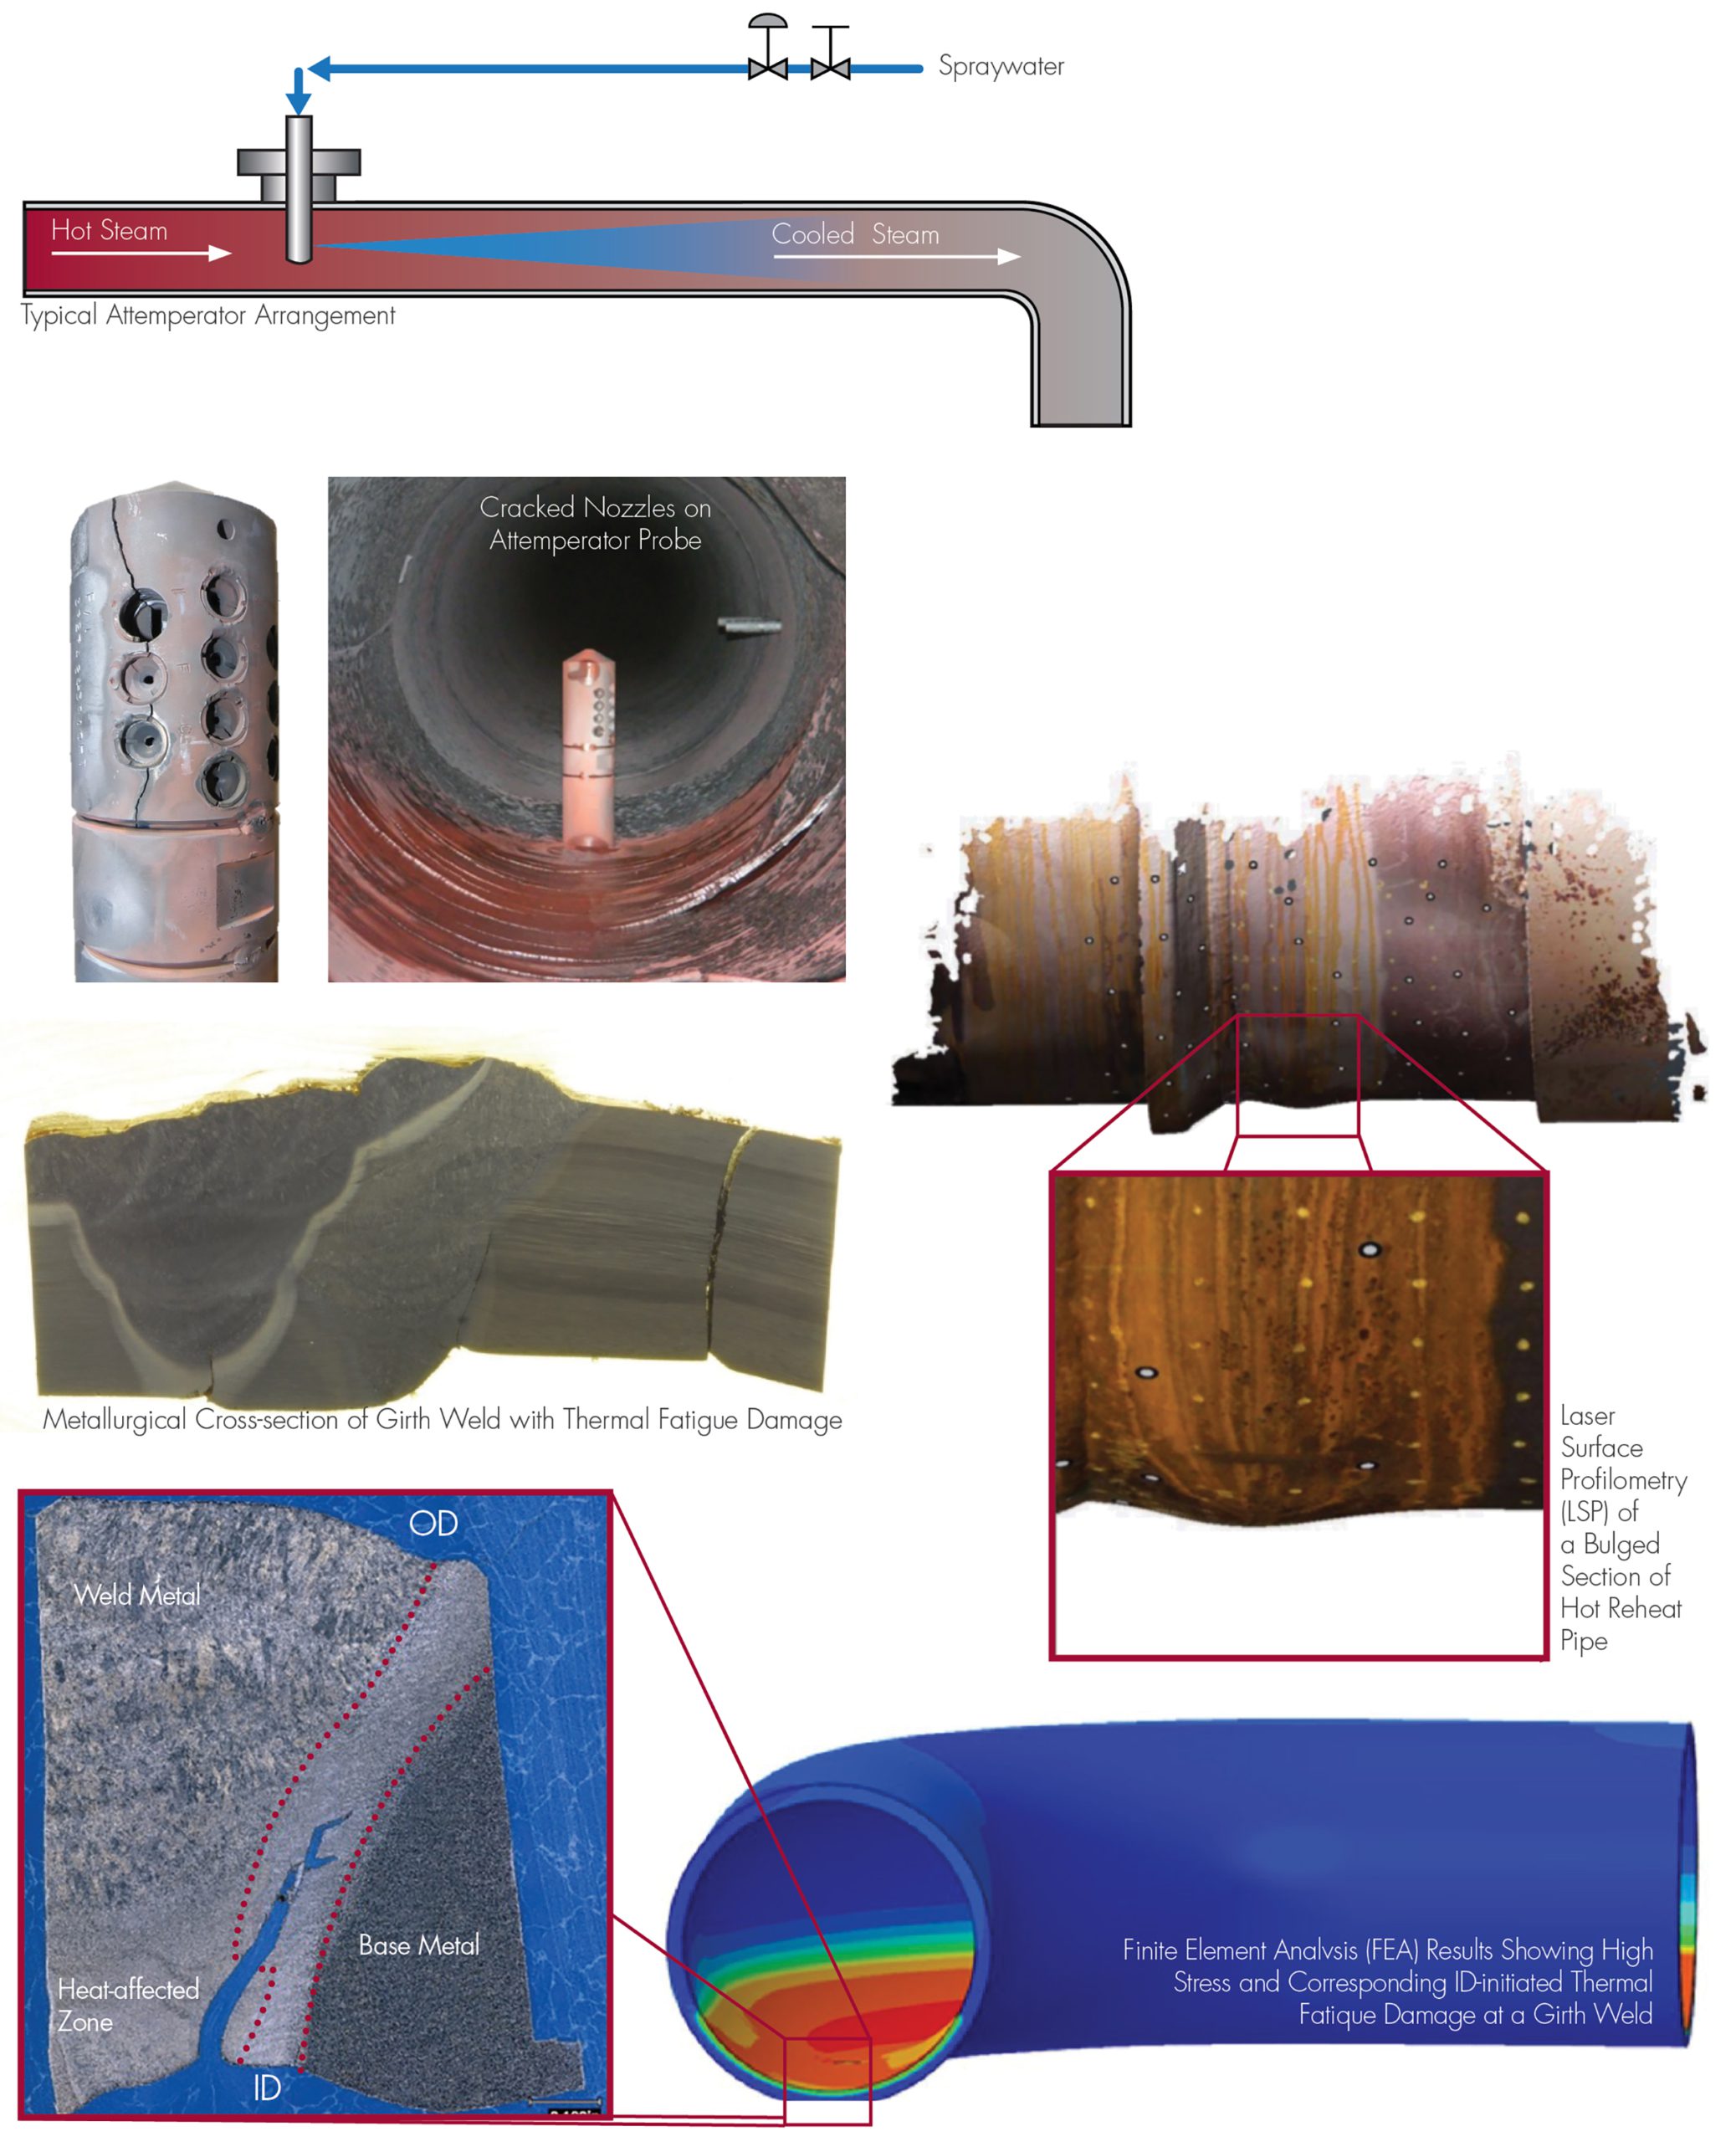


 SI has successfully implemented the initial application of an integrated monitoring solution that provides insight into damage evolution and operational risk using real-time data and automated engineering intelligence. This solution will assist in the optimization of maintenance activities and downtime, helping utilities get the most out of their O&M budgets. “This is a decisive step toward a more modern asset management approach that will lower O&M cost for our clients,” said Steve Gressler, Vice President, SI Energy Services Group, a division of Structural Integrity Associates, Inc. (SI) focused on power plant asset integrity.
 The ability to continuously monitor component thickness at high temperatures has many benefits in the power generation industry, as well as many other industries. Most significantly, it enables condition-based inspection and maintenance, as opposed to schedule-based, which assists plant management optimizing operations and maintenance budgets and streamlining outage schedules. Furthermore, it can assist with the early identification of potential issues, which may be used to further optimize plant operations and provides ample time for contingency and repair planning.