Manufacturing Supply Chain Upsets
MATERIALS LABORATORY CASE STUDY 6
THE PROBLEM
A supplier of electromagnetic interference (EMI) components noticed that one of their manufacturer’s components was not performing as well as similar components had previously. The supplier had several theories on the make-up of the component and asked SI to investigate and confirm the material constituents as well as their distribution across the thickness.
THE SOLUTION
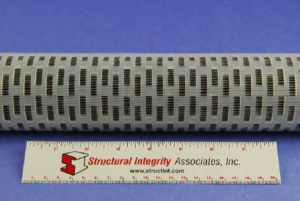
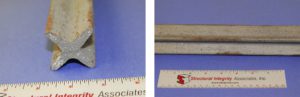
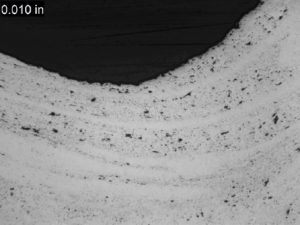
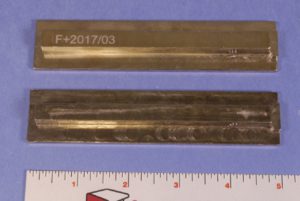
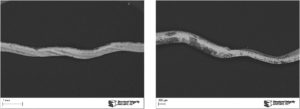
A small, coiled metallic sample, representative of the latest batch of material received from the manufacturer, was brought to SI’s Materials Laboratory for analysis. The goal of the analysis was to identify the elemental constituents present to help assess composition and also the distribution of the elements through the thickness. The sample was cross-sectioned and examined and documented in a scanning electron microscope (SEM) as shown in Figure 1. Using backscattered electrons (which help distinguish compositional differences) it was clear that the surfaces had a unique composition (dark grey) when compared to the base substrate (light grey).
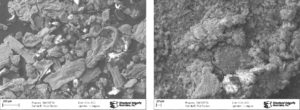
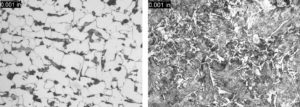
An elemental map of the cross-section was captured using energy dispersive X-ray spectroscopy (EDS) to identify the elements present across the thickness. The elemental map is provided in Figure 2 and the EDS analysis results are provided in Table 1. The sample was confirmed to comprise mostly of titanium and aluminum, which was expected, but was found to be titanium substrate with cladding of aluminum and silver on the surfaces .
Utilizing this information the supplier was able to engage with the manufacturer to help ensure that the material was being manufactured in a way suitable for the given end-use.
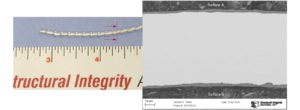
Figure 1. As received image of the metallic component and overall micrograph of the component cross-section red arrows show the cross-section location
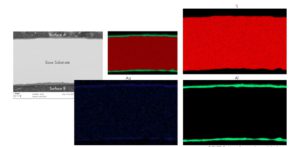
Figure 2. Maps showing elemental distribution through the component cross section
| Element | Surface A | Base Substrate | Surface B |
| Carbon | 10.2 | 7.2 | |
| Oxygen | 1.2 | 1.6 | |
| Sodium | 0.7 | 0.7 | |
| Magnesium | 0.8 | 1.1 | |
| Aluminum | 76.5 | 0.5 | 81.8 |
| Silicon | 0.3 | 0.5 | 0.4 |
| Calcium | 0.2 | 0.3 | |
| Titanium | 8.4 | 98.7 | 4.9 |
| Iron | 0.1 | 0.1 | 0.5 |
| Silver | 1.8 | 1.5 |
Elemental mapping is based on compiling extremely specific elemental composition data across an area of a sample. This is typically done in an SEM using EDS analysis. A high resolution image of the area of interest is collected along with the EDS data, and the two are correlated.
[1] The sample was prepared in a carbon-based mounting medium for use in the SEM, so much of the carbon is from sample preparation.


News & Views