THE PROBLEM A supplier of electromagnetic interference (EMI) components noticed that one of their manufacturer’s components was not performing as well as similar components had previously.The supplier had several theories on the make-up of the component and asked SI to investigate and confirm the material constituents as well as their distribution across the thickness.
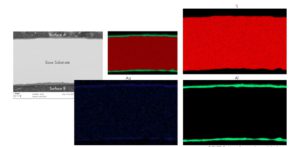
THE SOLUTION A small, coiled metallic sample, representative of the latest batch of material received from the manufacturer, was brought to SI’s Materials Laboratory for analysis. The goal of the analysis was to identify the elemental constituents present to help assess composition and also the distribution of the elements through the thickness. The sample was cross-sectioned and examined and documented in a scanning electron microscope (SEM) as shown in Figure 1. Using backscattered electrons (which help distinguish compositional differences) it was clear that the surfaces had a unique composition (dark grey) when compared to the base substrate (light grey).
An elemental map of the cross-section was captured using energy dispersive X-ray spectroscopy (EDS) to identify the elements present across the thickness. The elemental map is provided in Figure 2 and the EDS analysis results are provided in Table 1. The sample was confirmed to comprise mostly of titanium and aluminum, which was expected, but was found to be titanium substrate with cladding of aluminum and silver on the surfaces .
Utilizing this information the supplier was able to engage with the manufacturer to help ensure that the material was being manufactured in a way suitable for the given end-use.
Figure 1. As received image of the metallic component and overall micrograph of the component cross-section red arrows show the cross-section location
Figure 2. Maps showing elemental distribution through the component cross section
Element
Surface A
Base Substrate
Surface B
Carbon
10.2
7.2
Oxygen
1.2
1.6
Sodium
0.7
0.7
Magnesium
0.8
1.1
Aluminum
76.5
0.5
81.8
Silicon
0.3
0.5
0.4
Calcium
0.2
0.3
Titanium
8.4
98.7
4.9
Iron
0.1
0.1
0.5
Silver
1.8
1.5
Elemental mapping is based on compiling extremely specific elemental composition data across an area of a sample. This is typically done in an SEM using EDS analysis. A high resolution image of the area of interest is collected along with the EDS data, and the two are correlated.
[1] The sample was prepared in a carbon-based mounting medium for use in the SEM, so much of the carbon is from sample preparation.
THE PROBLEM A filter was removed from a stator cooling system after pressure differential sensors indicated it may be blocked. The filter was submitted to SI’s Materials Laboratory for analysis to help identify the material blocking it.
Figure 1. The filter shown in the as-received condition
Figure 2. The yellow color is the original appearance of the filter
THE SOLUTION The filter was visually examined and documented in the as-received condition as shown in Figure 1. The submitted sample had a perforated plastic shell that covered an inner filter. The outer plastic was removed to provide access to the filter underneath. Figure 2 shows close images of the filter, which was yellowish-white with much of its surface covered in gray colored debris/deposit.
Figure 3. SEM images of material removed directly from the filter (left) and particles from the evaporated MEK (right) B
A portion of the filter was scraped to remove the deposits. Another portion of the filter was removed and soaked in Methyl Ethyl Ketone (MEK) to remove the debris present on the filter. The solvent evaporated and the remaining particles were collected. Both samples were analyzed in a scanning electron microscope using energy dispersive X-ray Spectroscopy (EDS) to identify the elements present. The results are provided in Table 1. The results indicate that the filter debris was primarily copper oxide. Plant personnel reported that copper contamination could be occurring in the system, so these findings appeared to be consistent with plant information. With their suspicions confirmed, plant personnel were able to move forward with mitigation steps for keeping the filters from becoming blocked.
Element
Material Removed from Filer
Particles from MEK Wash
Carbon
4.9
ND
Oxygen
13.4
18.5
Aluminum
0.2
1.3
Silicon
0.4
4.2
Sulfur
0.1
0.3
Chlorine
0.1
0.1
Chromium
0.3
1.6
Iron
0.4
4.0
Nickel
ND
0.4
Copper
79.7
68.4
Tin
0.4
1.3
Table 1. Filter Material EDS Analysis Results (wt.%)
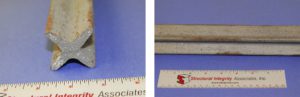
THE PROBLEM Structural Integrity received a section of an original star member from one of Austin’s Moonlight Towers (Figure 1). The material was suspected to be a ductile or malleable cast iron and the company refurbishing the towers needed to determine a suitable replacement material. SI was asked to perform materials testing on the sample to determine its chemical composition, measure its tensile strength, and evaluate the microstructure to determine the material type.
Figure 1. The star member shown in the as-received condition A
THE SOLUTION A portion of the star member was submitted for tensile testing and quantitative chemical analysis. Based on the compositional analysis, and particularly the carbon content, the star member is a low carbon steel and not a cast iron. The composition is consistent with UNS G10050 or ASTM A29 Grade 1005. The material was found to have a tensile strength of about 50 ksi and a yield strength of about 30 ksi.
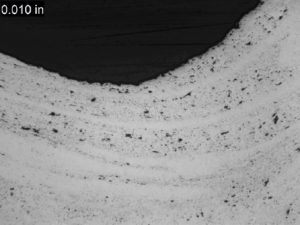
A cross-sectional sample from the star member was prepared for evaluation using standard laboratory techniques. The prepared sample was examined using a metallurgical microscope for evaluation of the microstructure, which is shown in Figure 2. The microstructure consisted of perlite, nonmetallic inclusions, and casting voids/flaws in a ferrite matrix. The microstructure is consistent with a low carbon steel and is not indicative of a ductile or malleable cast iron. The microstructure also showed significant deformation, presumably from forming the star shape (Figure 3). It is not clear if the casting voids/flaws present in the material indicate the material was originally cast and then formed, or if they are just indicative of the quality of the material at the time of manufacture (i.e., the component is not a casting).
With the information from this analysis, the company performing the refurbishment was able to select a suitable material to replace the old, original Moonlight Tower star members.
Figure 2. The typical star member microstructure A
Figure 3. Deformation in the microstructure
MOONLIGHT TOWERS The moonlight towers in Austin, Texas, are the only known surviving moonlight towers in the world. They are 165 feet (50 m) tall and have a 15-foot (4.6 m) foundation. A single tower originally cast light from six carbon arc lamps, illuminating a 1,500-foot-radius (460 m) circle brightly enough to read a watch. In 1894, the City of Austin purchased 31 used towers from Detroit. They were manufactured in Indiana by Fort Wayne Electric Company and assembled onsite. When first erected, the towers were connected to electric generators at the Austin Dam, completed in 1893 on the site of present-day Tom Miller Dam. In the 1920s their original carbon-arc lamps, which were exceedingly bright but time-consuming to maintain, were replaced by incandescent lamps, which gave way in turn to mercury vapor lamps in the 1930s. The mercury vapor lamps were controlled by a switch at each tower’s base. During World War II, a central switch was installed, allowing citywide blackouts in case of air raids. (source: Wikipedia)
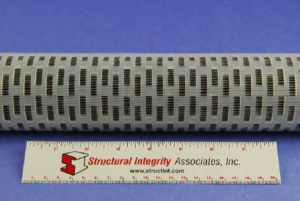
THE PROBLEM Structural Integrity received several sections of core reinforcing steel from a client performing work at a local university gymnasium (Figure 1). SI’s client needs to have an understanding of the material tensile strength in order to obtain the appropriate replacement material.
THE SOLUTION Cross-sections were removed from each of the five samples and prepared for hardness testing. The hardness testing was performed as follows:
Shimadzu Microhardness Tester (HMV-2) –1.961 N load
Unit calibrated with a 206 Vickers (HV) sample block
Five readings were made on each sample
The five hardness readings from each sample were averaged and used to estimate the approximate UTS, and the material verification results are provided below.
Figure 1. The core reinforcing steel samples in the as-received condition
Sample ID
Average Hardness (HV)
Approximate UTS (ksi)
C1-1
144.2
69
C1-2
147.6
70
C2-1
192.2
89
C2-2
198.6
92
C2-3
169.6
79
HARDENESS VS. TENSILE STRENGTH Hardness is a measure of the resistance to localized plastic deformation induced by either mechanical indentation or abrasion, while ultimate tensile strength is the maximum stress that a material can withstand while being stretched or pulled before breaking. Because hardness can often be measured much more readily than tensile strength, it is convenient to use hardness to estimate tensile strength. Hardness correlates linearly to ultimate tensile strength through the empirical (although theoretically explained) equation H=UTS/k. Tensile strength estimates based on hardness should be used for guidance only and should not be used as set reference values. Some material conditions, especially cold work, can change the relationship between the tensile strength and hardness profoundly.
THE PROBLEM A manufacturer noticed recent material provided by a supplier was not performing as well as what had been provided previously, and asked SI’s Materials Laboratory to investigate.
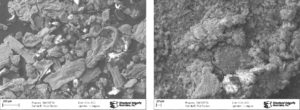
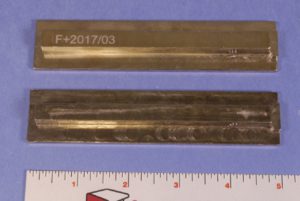
THE SOLUTION Two pieces of stock material were submitted for analysis (Figure 1). The sample marked as F was the most recent material supplied to a manufacturer and the unmarked sample was the material that had been previously supplied. The newer material was not performing as expected and SI was asked to compare the two samples to identify any differences.
Figure 1. The submitted samples of material
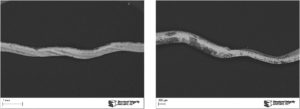
Cross sections were removed from both samples and prepared for metallographic examination. The microstructures from each are shown in Figure 2. The newer material (sample marked “F”) had a microstructure consisting of pearlite in a ferrite matrix. The previously manufacturer supplied material had a microstructure consisting of Widmanstätten ferrite and bainite. Hardness measurements were made on each prepared sample. The F sample had an average hardness of 66.7 Rockwell B and the unmarked sample had an average hardness of 90 Rockwell B. The measured hardness values were consistent with the observed microstructures.
The pearlitic microstructure and lower hardness value indicate that the newer material would have a lower tensile strength than the older material, which was likely the reason it was not performing as expected in its final application. Armed with this information the manufacturer has the information necessary to resolve the issue with the supplier.
Figure 2. The typical microstructures from the marked sample (left) and the unmarked sample (right)
TEST METHOD DETAIL Metallographic examination involves mounting the cross-section, then grinding, polishing and etching. In this case, the carbon steel material was etched with a 2% Nital solution. The prepared sample was examined using an optical metallurgical microscope for examination at magnifications up to 1000X. The images shown were originally taken at 500X.
THE PROBLEM A small metallic particle that had contaminated a product line was brought to SI’s Materials Laboratory for analysis.The goal of the analysis was to identify the particle’s composition to help identify its original source.
THE SOLUTION The particle was examined and documented in a scanning electron microscope (SEM) as shown in Figure 1. The particle was several millimeters long and appeared to have been originally round in cross-section with subsequent mechanical deformation. The particle exhibited intermittent areas of a surface deposits that appeared black in the SEM images.
Figure 1. SEM images of the particle
An area that was relatively free of the surface deposit was analyzed using energy dispersive X-ray spectroscopy (EDS) to identify the element present in the base material. The EDS analysis are provided in the table. The particle was attached to an aluminum planchet with a piece of carbon tape, so much of the carbon is from the sample preparation. The EDS results indicated the particle was essentially an iron-based metal with approximately 18% chromium and 8% nickel, which is consistent with Type 304 stainless steel. Knowing the composition, the manufacturer is investigating possible sources.
Element
Weight %
Carbon
4.2
Oxygen
1.5
Aluminum
0.2
Silicon
0.9
Chlorine
0.1
Chromium
17.9
Manganese
3.8
Iron
63.5
Nickel
7.4
Molybdenum
0.4
TEST METHOD DETAIL
EDS provides qualitative elemental analysis of materials based on the characteristic energies of X-rays produced by the SEM electron beam striking the sample. Using a light element detector, EDS can identify elements with atomic number 5 (boron) and above. Elements with atomic number 13 (aluminum) and higher can be detected at concentrations as low as 0.2 weight percent; lighter elements are detectable at somewhat higher concentrations. As performed in this examination, EDS cannot detect the elements with atomic numbers less than 5 (beryllium, lithium, helium or hydrogen). The relative concentrations of the identified elements were determined using semiquantitative, standardless quantification (SQ) software. The results of this analysis are semi-quantitative and indicate relative amounts of the elemental constituents.
‘SI is proud to have SI Expert and Senior Associate, Dr. Barry Dooley presenting at the HRSG Forum on August 19that 11 am (EST).
TOPIC: Introduction to the Key Cycle Chemistry Features for HRSG Reliability
The basic rules for providing optimum cycle chemistry control for HRSGs will be outlined. The latest statistics from over 100 HRSG plants worldwide will show how the lack of basic cycle chemistry controls leads to the major failure/damage mechanisms. The following two presentations will provide information on what is acceptable for the two top situations involving monitoring iron and continuous instrumentation.
Structural Integrity’s Own, Andy Coughlin published by American Society of Civil Engineers, ASCE
Andy Coughlin’s work has been published in the ASCE Structural Design for Physical Security: State of the Practice. The Task Committee on Structural Design prepared the publication for Physical Security of the Blast, Shock, and Impact Committee of the Dynamic Effects Technical Administration Committee of the Structural Engineering Institute of ASCE. Andy wrote Chapter 10 on Testing and Certification for Physical Security and assisted on several other chapters.
Structural Design for Physical Security, MOP 142, provides an overview of the typical design considerations encountered in new construction and renovation of facilities for physical security. The constant change in threat tactics and types has led to the need for physical security designs that account for these new considerations and anticipate the environment of the future, with flexibility and adaptability being priorities. This Manual of Practice serves as a replacement for the 1999 technical report Structural Design for Physical Security: State of the Practice and is intended to provide a roadmap for designers and engineers involved in physical security. It contains references to other books, standards, and research.
Topics include
Threat determination and available assessment and criteria documents,
Methods by which structural loadings are derived for the determined threats,
Function and selection of structural systems,
Design of structural components,
Function and selection of window and facade components,
Specific considerations for retrofitting structures,
Testing methodologies, and
Bridge security.
This book will be a valuable resource to structural engineers and design professionals involved with projects that have physical security concerns related to explosive, ballistic, forced entry, and hostile vehicle threats.
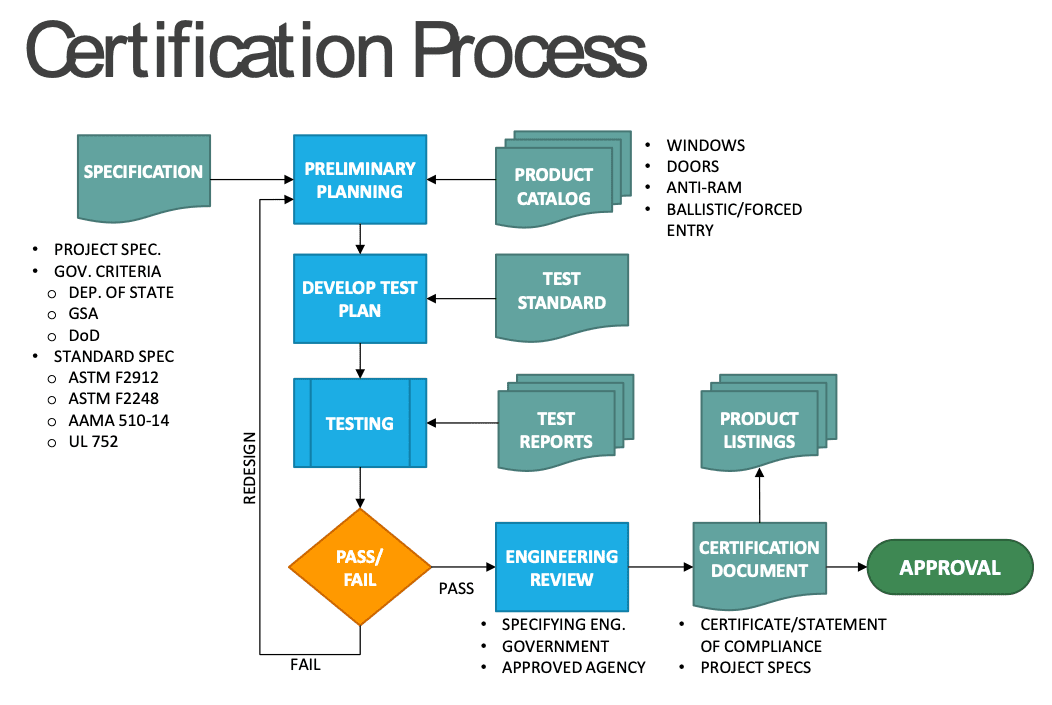
Of particular note is the publication of the process by which products can be tested and certified to achieve physical security performance in blast, ballistics, forced entry, and vehicle impact. Often unclear or overly specific requirements hamper the application of quality products which protect people and assets from attack. The certification process below shows how approved agencies, like SI’s TRU Compliance, play a role in testing, evaluating, and selecting products for use in critical physical security applications, rather than relying solely on the claims of the manufacturers. TRU’s certification program is the first of its kind to receive IAS Accreditation for the certification of physical security products.
https://www.structint.com/wp-content/uploads/2021/08/American-Society-of-Civil-Engineers-ASCE-Featured-Image.jpg363668Structural Integrityhttps://www.structint.com/wp-content/uploads/2023/05/logo-name-4-930x191-1.pngStructural Integrity2021-08-13 14:38:512021-10-04 18:09:26Structural Design for Physical Security
By: Daniel Peters (SI) and Thomas Pastor (HSB Global Inspection & Engineering Services)
A recent news story reported:
Hydrogen initiatives are accelerating globally.
200+ large-scale projects have been announced across the value chain, with a total value exceeding $300 billion
30+ countries have national hydrogen strategies in place, and public funding is growing
Anyone who is following climate change issues and the expansion of the use of renewable energy would have seen the subject hydrogen popping up all over the place. Just do a Google search using the following words “hydrogen renewable energy climate change” and dozens of links will be displayed promoting the use of green or renewable hydrogen, made from the electrolysis of water powered by solar or wind, as indispensable in achieving climate neutrality.
https://www.structint.com/wp-content/uploads/2021/07/Whats-All-the-Buzz-About-Hydrogen-News-and-Views-Volume-50-POST.jpg363668Structural Integrityhttps://www.structint.com/wp-content/uploads/2023/05/logo-name-4-930x191-1.pngStructural Integrity2021-07-01 15:28:352021-09-03 12:57:35News and Views, Volume 50 | What’s All the Buzz About Hydrogen!
The goal was to determine whether the frequency of current inspection requirements was justified or could be optimized (i.e., increase the interval of certain inspections to devote more attention to higher-value inspections and thereby maximize overall plant safety).
Executive Summary Welds and similar components in nuclear power plants are subjected to periodic examination under ASME Code, Section XI.Typically, examinations are performed during every ten-year inspection interval using volumetric examination techniques, or a combination of volumetric and surface examination techniques.Nuclear plants worldwide have performed numerous such inspections over plant history with few service induced flaws identified.
SI was selected by the Electric Power Research Institute (EPRI) to review the technical bases for the inspection intervals for select components.The goal was to determine whether the frequency of current inspection requirements was justified or could be optimized (i.e., increase the interval of certain inspections to devote more attention to higher-value inspections and thereby maximize overall plant safety.)
An inspection interval review takes into consideration industry operating experience (OE), operating history and previous inspection data.Many of the components / welds are difficult to access (require scaffolding and removing insulation), require manual techniques of inspection, and are typically in high radiological dose areas.The inspections can also have significant impact to outage duration.Reducing the frequency of inspections has the potential for time and cost savings during outages and reduces the radiation exposure to plant personnel.From the inspection interval review, one utility noted that increasing the inspection interval for steam generator nozzle welds from 10 years to 30 years would save over $600,000 of inspection and supporting activity costs over a 60-year licensed period of operation.Actual savings for a given plant are situation-dependent, although the potential for significant Operations and Maintenance (O&M) savings exists.
Background
To identify which components and inspection requirements were most suitable for optimization, EPRI performed an initial scoping investigation to collect the following information:
The original bases for the examinations, if any;
Applicable degradation mechanisms, and the potential to mitigate any potential damage associated with each mechanism;
Operating experience, examination data, and examination results, e.g., fleet experience;
Previous relief requests submitted to regulators;
Industry guidance documents that replace or complement ASME Code requirements;
Redundancy of inspections caused by other industry materials initiatives and activities (e.g., Boiling Water Reactor Vessel and Internals Project (BWRVIP), Materials Reliability Program (MRP), etc.); and
Existing ASME Code Cases that provide alternatives to existing ASME Code inspection requirements and their bases.
After compilation and review of the information collected, EPRI and their members determined that the inspection requirements for the following components were among the most suitable for optimization:
Pressurized water reactor (PWR) steam generator shell and nozzle welds and nozzle inside radius sections;
PWR pressurizer shell and nozzle welds; and
Boiling water reactor (BWR) heat exchanger shell and nozzle welds and nozzle inside radius sections.
Once the components were identified, EPRI contracted with SI to support development of the technical bases to optimize the related inspections.These evaluations are documented in the following four EPRI reports, all of which are publicly available for download at www.epri.com:
Technical Bases for Inspection Requirements for PWR Steam Generator Feedwater and Main Steam Nozzle-to-Shell Welds and Nozzle Inside Radius Sections, EPRI, Palo Alto, CA: 2019. 3002014590.
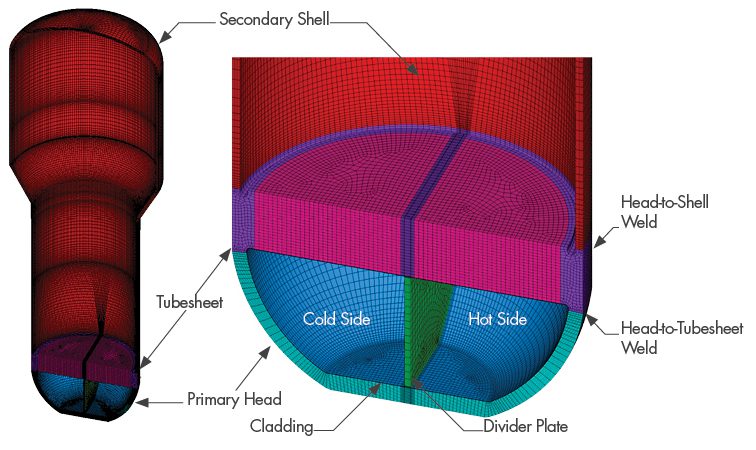
Technical Bases for Inspection Requirements for PWR Steam Generator Class 1 Nozzle-to-Vessel Welds and Class 2 Vessel Head, Shell, Tubesheet-to-Head, and Tubesheet-to-Shell Welds, EPRI, Palo Alto, CA: 2019. 3002015906.
Technical Bases for Inspection Requirements for PWR Pressurizer Head, Shell-to-Head, and Nozzle-to-Vessel Welds, EPRI, Palo Alto, CA: 2019. 3002015905.
Technical Bases for Examination Requirements for Class 2 BWR Heat Exchanger Nozzle-to-Shell Welds; Nozzle Inside Radius Sections; and Vessel Head, Shell, and Tubesheet-to-Shell Welds, EPRI, Palo Alto, CA: 2020. 3002018473.
Why It Matters
Recent efforts in the nuclear industry include a focus on reducing the cost of generating electricity to make nuclear more competitive with other sources (natural gas, etc.).A major component of these efforts is a targeted reduction of plant O&M costs, while ensuring that there is no detrimental impact on plant safety.Reducing low-value (i.e., low-risk, high-cost) inspections allows plant resources to be devoted to higher value activities (e.g., preventative maintenance).This is one benefit of employing risk-informed approaches.
The industry (in conjunction with EPRI, SI, and others) has shown a great deal of interest in employing risk-informed approaches where appropriate.Such efforts include (but are not limited to):
Extremely Low Probability of Rupture (xLPR)
ASME Code Case N-702 (alternative requirements for BWR nozzle inner radius and nozzle-to-shell welds)
ASME Code Case N-711 (volume of primary interest)
ASME Code Case N-716-1 (streamlined risk-informed inservice inspection)
ASME Code Case N-752 (risk-informed repair / replacement)
ASME Code Case N-770-6 (cold leg piping dissimilar metal butt weld inspection)
ASME Code Case N-864 (reactor vessel threads in flange examinations)
ASME Code Case N-885 (alternative requirements for interior of reactor vessel, welded core support structures and interior attachments to reactor vessels, and removable core support structures)
ASME Code Case N-[xxx] (alternative requirements for pressure-retaining bolting greater than 2 inches in diameter)
10CFR50.69 (risk-informed categorization and treatment of systems, structures, and components)
The inspection optimization approach discussed here is congruent with these other approaches, as it uses probabilistic and risk insights to help plants to prioritize inspection and maintenance activities on those components most significant to plant safety.
How It’s Done
In the four EPRI reports cited above, the technical basis for increasing the interval of components inspections included the following steps:
Review of previous related projects
Review of inspection history and examination effectiveness
Survey of components and selection of representative components for analysis
Evaluation of potential degradation mechanisms
Component stress analysis
Once the above steps were completed, components are subjected to Deterministic and Probabilistic Fracture Mechanics Evaluations.The DFM and PFM approaches used in the EPRI reports are based on methods used in previous inspection optimization projects, and involved either an increase in examination interval, a reduction in examination scope, or both.The DFM evaluations were performed using bounding inputs to determine the length of acceptable component operability with a postulated flaw.The results of the DFM investigation were also to determine the critical stress paths for consideration in the PFM analyses.The results of the DFM evaluations concluded that all selected components are very flaw tolerant, with the capability of operating with a postulated flaw for more than 80 years.
PFM evaluations were performed to demonstrate the reliability of each selected component assuming various inspection scenarios (e.g., preservice inspection (PSI) only, PSI followed by 10-year in-service inspections (ISI), etc.).Monte Carlo probabilistic analysis techniques were used to determine the effect of randomized inputs and various inspection scenarios on the probabilities of rupture and leakage for the selected components.Sensitivity studies are performed to investigate possible variation in the various input parameters to establish the key parameters that most influence the results.
For each component, probabilities of rupture and leakage were determined for the limiting stress paths in each selected component for a variety of inspection scenarios.The results of the PFM evaluations demonstrated that the NRC acceptance criteria of 1.0E-6 for both probabilities of rupture and leakage could be maintained for all components for inspection intervals longer than the 10-year intervals defined in Section XI of the ASME Code.Therefore, the results demonstrate that examinations for the selected components can be extended beyond current the ASME Code-defined interval; in some cases, they can be extended out to the end of the current licensed operating period (at least 30 years for most plants).
Why Structural Integrity
SI is the primary author of the four EPRI Reports cited above (3002014590, 3002015906, 3002015905 and 3002018473).The inspection optimization projects have provided SI with the opportunity to use its experience in structural reliability to develop a customized PFM software tool named PROMISE (PRobablistic OptiMization of InSpEction), which was used to optimize the inspection schedules for various plant components.The PROMISE software implemented a probabilistic model of fatigue crack growth using linear elastic fracture mechanics (LEFM) methods, consistent with ASME code, Section XI flaw evaluation procedures.
The software was developed, verified & validated (V&V), and tested under the provisions of a 10 CFR 50, Appendix B Nuclear Quality Assurance Program.This tool is based on other, similar previous software codes, and it can be used for similar applications in the nuclear industry where a rigorous technical basis is required to optimize inspection schedules for high-reliability components involving significant outage impact.In 2020, the NRC staff conducted an audit of PROMISE.According to the conclusion of the audit report (ML20258A002), the NRC staff gained a better understanding of how PFM principles were implemented in PROMISE and of the V&V on the software.
In addition to the software audit, SI has supported EPRI and industry in developing responses to NRC requests for additional information (RAIs) for the pilot plant submittals for all four EPRI Reports.This experience has given SI a great deal of understanding regarding the most efficient and effective way to preemptively address potential NRC concerns in future plant-specific submittals.
How It Would Work For You
For plant owners to use the technical bases established by this work to obtain relief for their plant, they must demonstrate that the representative geometries, materials, and loading conditions used for the selected components bound their plant-specific information.Based on this analysis, the EPRI Reports provide criteria for each component regarding the component configuration, component dimensions, component materials, applicable transient loadings, and other relevant parameters that must be satisfied on a plant-specific basis.If all criteria are satisfied on a plant-specific basis for a given component, the results of the investigation can be used for the plant as the technical basis to establish revised inspection schedules for that component.If any criteria are not satisfied, then plant-specific analysis is required to address any unbounded conditions.SI can provide support in several areas, including:
Since the technical basis in the EPRI Reports used generic plant configurations, some plant configurations were not included in the analysis.SI can also support efforts by plants with such configurations to determine whether they are bounded by the criteria of the EPRI Reports.
Evaluation of plant-specific parameters against report criteria to determine whether a given plant configuration is bounded
Performing plant-specific analysis (e.g., component stress analysis, DFM and PFM, etc.) required to address any unbounded conditions
Supporting development of the relief request to proactively address known NRC areas of concern
Supporting development of responses to any NRC requests for additional information
Plant Experience To Date
The first plant-specific submittal was made by a U.S. two-unit PWR site in December 2019 based on EPRI Report 3002014590, requesting an inspection alternative to current ASME Code, Section XI examination requirements for steam generator main steam and feedwater nozzle-to-shell weld and inner radii examinations.The alternative requests an increase in the inspection interval for these items from 10 to 30 years.The safety evaluation report (SER) for this alternative was received from the NRC in January 2021.
The first plant-specific submittal was made by a U.S. PWR site in December 2019 based on EPRI Report 3002015906, requesting an inspection alternative to current ASME Code, Section XI examination requirements for steam generator Class 1 nozzle-to-vessel welds and Class 2 vessel head, shell, tubesheet-to-head, and tubesheet-to-shell welds.The alternative requests an increase in the inspection interval for these items from 10 to 30 years.RAIs for this alternative were received from the NRC in February 2021.SI supported development of the RAI responses.
The first plant-specific submittal was made by a U.S. two-unit PWR site in December 2019 based on EPRI Report 3002015905, requesting an inspection alternative to current ASME Code, Section XI examination requirements for Pressurizer Head, Shell-to-Head, and Nozzle-to-Vessel Welds.The alternative requests an increase in the inspection frequency for these items from 10 to 30 years.RAIs for this alternative were received from the NRC in February 2021.SI supported development of the RAI responses.
The first plant-specific submittal was made by a U.S. two-unit BWR site in December 2019 based on EPRI Report 3002018473, requesting an inspection alternative to current ASME Code, Section XI examination requirements for Class 2 BWR heat exchanger nozzle-to-shell welds; nozzle inside radius sections; and vessel head, shell, and tubesheet-to-shell welds.The alternative requests an increase in the inspection interval for these items from 10 years to the end of the plant’s current operating license.RAIs for this alternative were received from the NRC in February 2021.SI supported development of the RAI responses.
Conclusion
Inspection optimization offers the opportunity to reallocate plant resources to higher value activities.In a highly competitive electricity market, the work here has shown opportunity exists to improve O&M costs and maintain safety through effective analysis.
SI brings to bear the prior experience in developing the methodology with EPRI, proprietary NQA-1 verified software, and decades of industry credibility to support all aspects of the efforts required to institute a program of inspection optimization.
We may request cookies to be set on your device. We use cookies to let us know when you visit our websites, how you interact with us, to enrich your user experience, and to customize your relationship with our website.
Click on the different category headings to find out more. You can also change some of your preferences. Note that blocking some types of cookies may impact your experience on our websites and the services we are able to offer.
Essential Website Cookies
These cookies are strictly necessary to provide you with services available through our website and to use some of its features.
Because these cookies are strictly necessary to deliver the website, refusing them will have impact how our site functions. You always can block or delete cookies by changing your browser settings and force blocking all cookies on this website. But this will always prompt you to accept/refuse cookies when revisiting our site.
We fully respect if you want to refuse cookies but to avoid asking you again and again kindly allow us to store a cookie for that. You are free to opt out any time or opt in for other cookies to get a better experience. If you refuse cookies we will remove all set cookies in our domain.
We provide you with a list of stored cookies on your computer in our domain so you can check what we stored. Due to security reasons we are not able to show or modify cookies from other domains. You can check these in your browser security settings.
Google Analytics Cookies
These cookies collect information that is used either in aggregate form to help us understand how our website is being used or how effective our marketing campaigns are, or to help us customize our website and application for you in order to enhance your experience.
If you do not want that we track your visit to our site you can disable tracking in your browser here:
Other external services
We also use different external services like Google Webfonts, Google Maps, and external Video providers. Since these providers may collect personal data like your IP address we allow you to block them here. Please be aware that this might heavily reduce the functionality and appearance of our site. Changes will take effect once you reload the page.
Google Webfont Settings:
Google Map Settings:
Google reCaptcha Settings:
Vimeo and Youtube video embeds:
Other cookies
The following cookies are also needed - You can choose if you want to allow them:
Privacy Policy
You can read about our cookies and privacy settings in detail on our Privacy Policy Page.