News and Views, Volume 55 | Nonintrusive and Robotic Solutions for Tank Asset Management

By:  Jason Van Velsor

Nuclear plant aging management programs require periodic inspections of liquid storage tanks. Traditional inspection methods can be disruptive, requiring tanks to be drained to provide personnel access. SI has developed innovative solutions, including screening techniques that can identify degradation from the tank exterior, and submersible robotics that perform comprehensive NDE without draining. Although initially developed for nuclear applications, these technologies can be employed at conventional power generation, petrochemical, and municipal utility facilities.

Nuclear Industry Guidelines

The nuclear industry established guidelines for integrity management of underground piping and tanks in the early 2000s with the publication of NEI 09-14. More recently, additional constraints have been imposed for plants pursuing life extension, especially for sites applying for subsequent license renewal (SLR) to extend permitted operation from 60 to 80 years. These new requirements for outdoor and large atmospheric tanks are conveyed in the form of specific guidelines for aging management programs (AMPs) within NUREG-1801, Revision 2 and NUREG-2191, Revision 1.

The guidelines within the NUREG documents apply to:

  • All metallic outdoor tanks constructed on soil or concrete.
  • Indoor metallic storage tanks with capacities greater than 100,000 gallons, designed for internal pressures approximating atmospheric conditions, and exposed internally to water.
  • Other indoor metallic tanks that sit on, or are embedded in, concrete, where plant-specific operating experience reveals that the tank bottom (or sides for embedded tanks) to concrete interface is periodically exposed to moisture.
  • For utilities with tanks meeting the above criteria, license renewal commitments generally necessitate performing examinations under one of the following three categories:
    • Inspection of the bottom 20% of walls for wall loss and cracking.
    • Inspection of the outer two feet of the floor plates for pitting/cracking.
    • 100% inspection of the bottom floor plates.

Conducting floor inspections using traditional approaches that require draining and personnel entrance into the tank can be undesirable, given the potential impact on operations, as well as the possibility for certain tanks to contain radiological content. For this reason, many utilities have begun pursuing alternative solutions to safely and accurately perform tank inspections.

Traditional Approaches

Historically, utilities have emptied and entered tanks to conduct manual floor inspections. The scope of these examinations can range anywhere from visual to full volumetric inspection of the tank floor using electromagnetic or ultrasonic techniques. More recently, utilities have attempted to utilize robotically deployed examination methods to avoid emptying and entering tanks. Obtaining large-area NDE coverage of tank floors with robotic methods has usually fallen into one of two categories:

  1. Relatively simple robotic systems that deploy traditional NDE sensors for localized measurements, which may take an impractical amount of time to reliably obtain the required coverage, or…
  2. Relatively complex robotic systems that deploy a large quantity of traditional NDE sensors to obtain the required coverage more quickly, but that are large, complex, and often expensive to deploy. 

Deploying any robotics in tanks is a challenging endeavor, with many practical factors that affect the ease and success of implementation. Several of these factors include:

  • Accessibility – there are limited access points to the inside of a tank; they are often on top of the tank, and just large enough for a person to fit through.
  • Visibility – maneuvering within a liquid-filled tank often relies on optical methods, which are impaired or even ineffective in murky or opaque liquid.
  • Navigation – with poor visibility, continuously tracking the position of a robot within a tank (and hence, the location of acquired data) can be unreliable.
  • Cleanliness – sediment present in the tank can impair data acquisition and cause additional visibility issues if agitated by the robot.
  • Geometry – getting complete coverage at the tank edges and around internal features can be challenging or impossible given the size and limited maneuverability of some robotic systems.
  • Tank Size / Inspection Time – for large tanks, obtaining complete coverage of all in-scope surfaces may require extended scanning time, which can impact operations and delay return to service.
  • Liners/Coatings – tanks that have been lined with thick coatings such as fiberglass or carbon wrap can render traditional NDE methods useless.

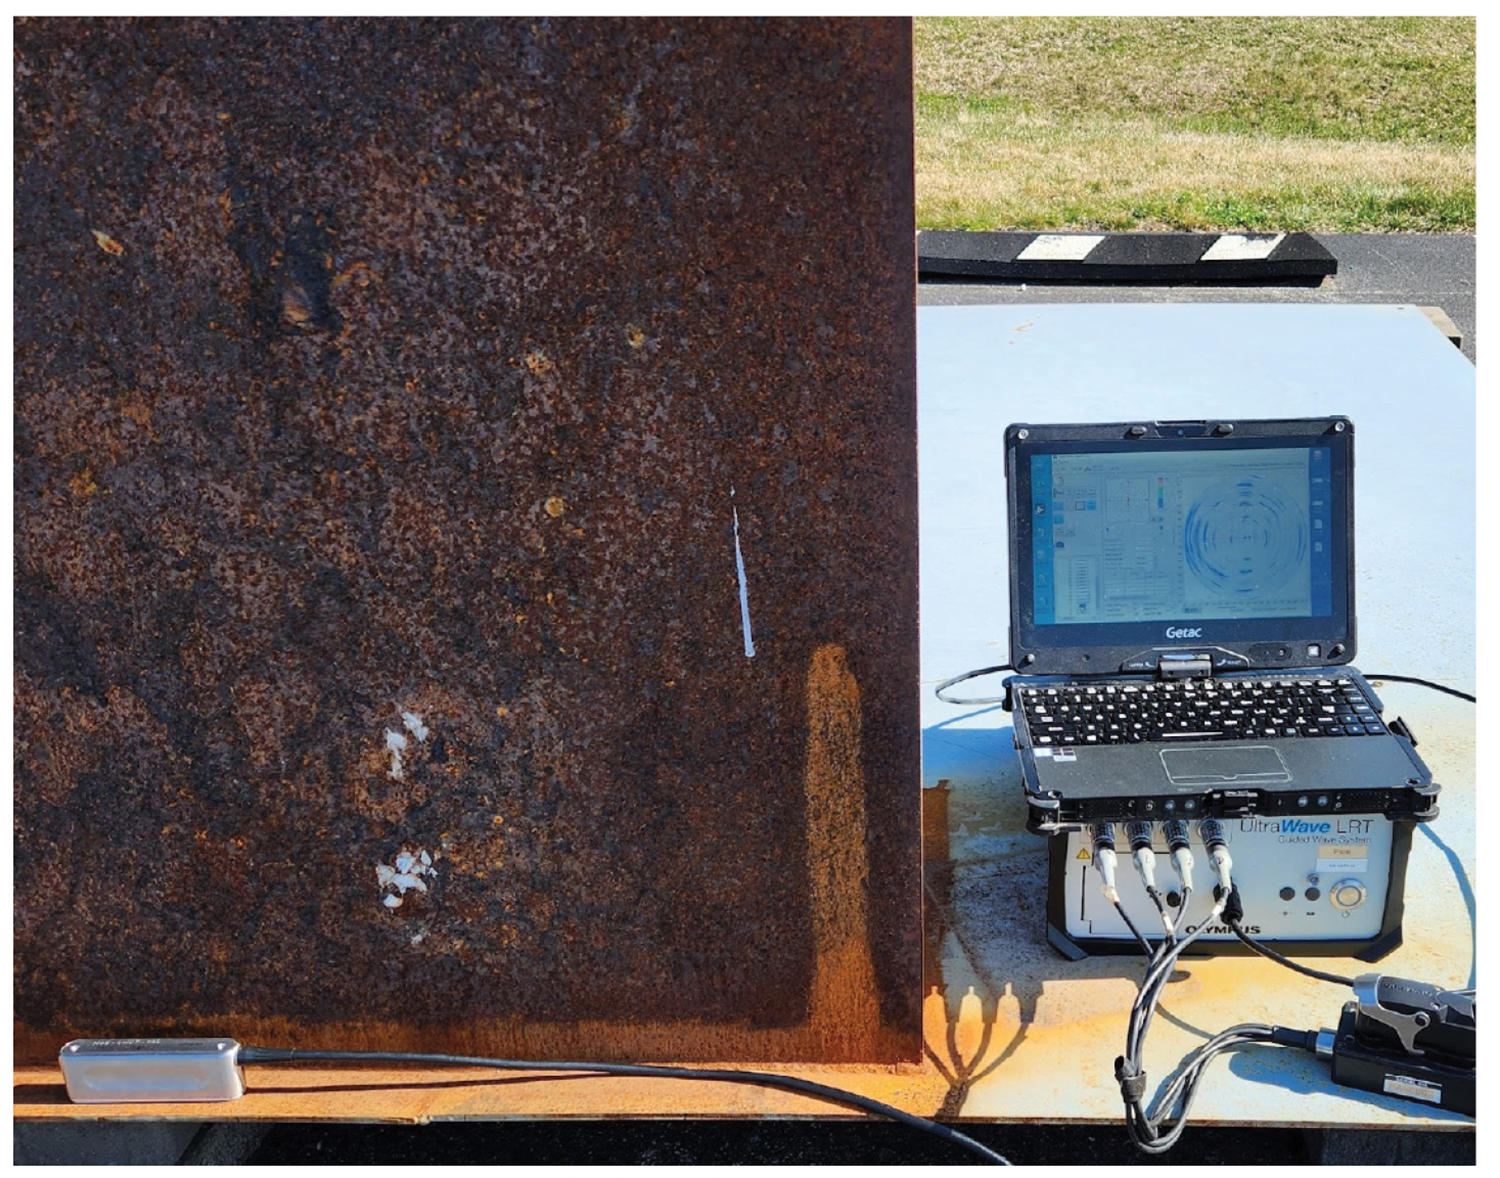
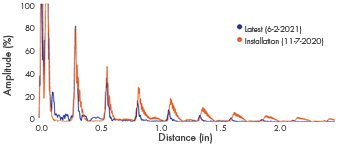
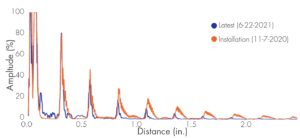
Figure 1. GWPA from Tank Chime

SI’s Approach

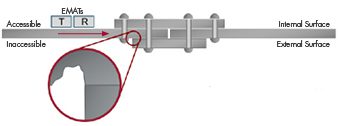
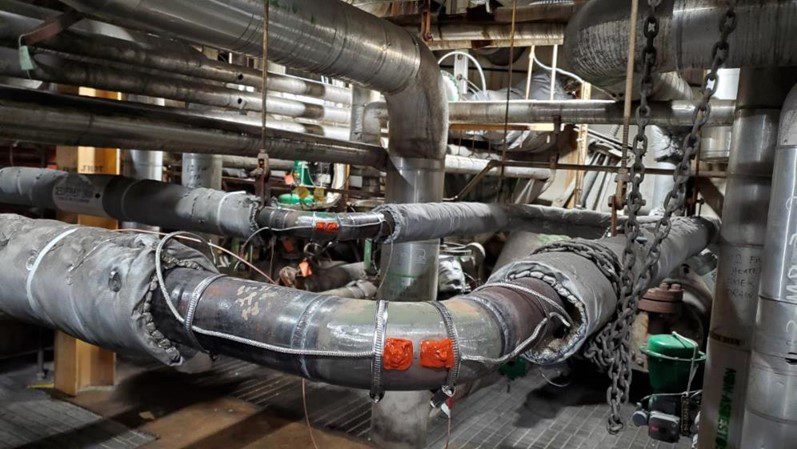
SI offers a suite of engineering and inspection solutions that are designed to help our clients meet their examination commitments while minimizing the associated cost, time, and impact to operations. We work with our clients to determine the required scope of any necessary examinations, based on their Aging Management Program and license renewal commitments, and present a customized inspection approach. Where possible, inspection solutions that can be conducted from outside of the tank are prioritized over approaches that require deploying equipment in the tank. These approaches may include performing pulsed eddy current testing to examine tank walls through insulation or employing guided wave phased array (GWPA) from the tank chime plate to examine the outer annulus of the tank floor (Figure 1).

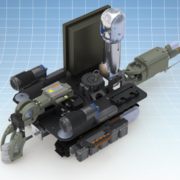
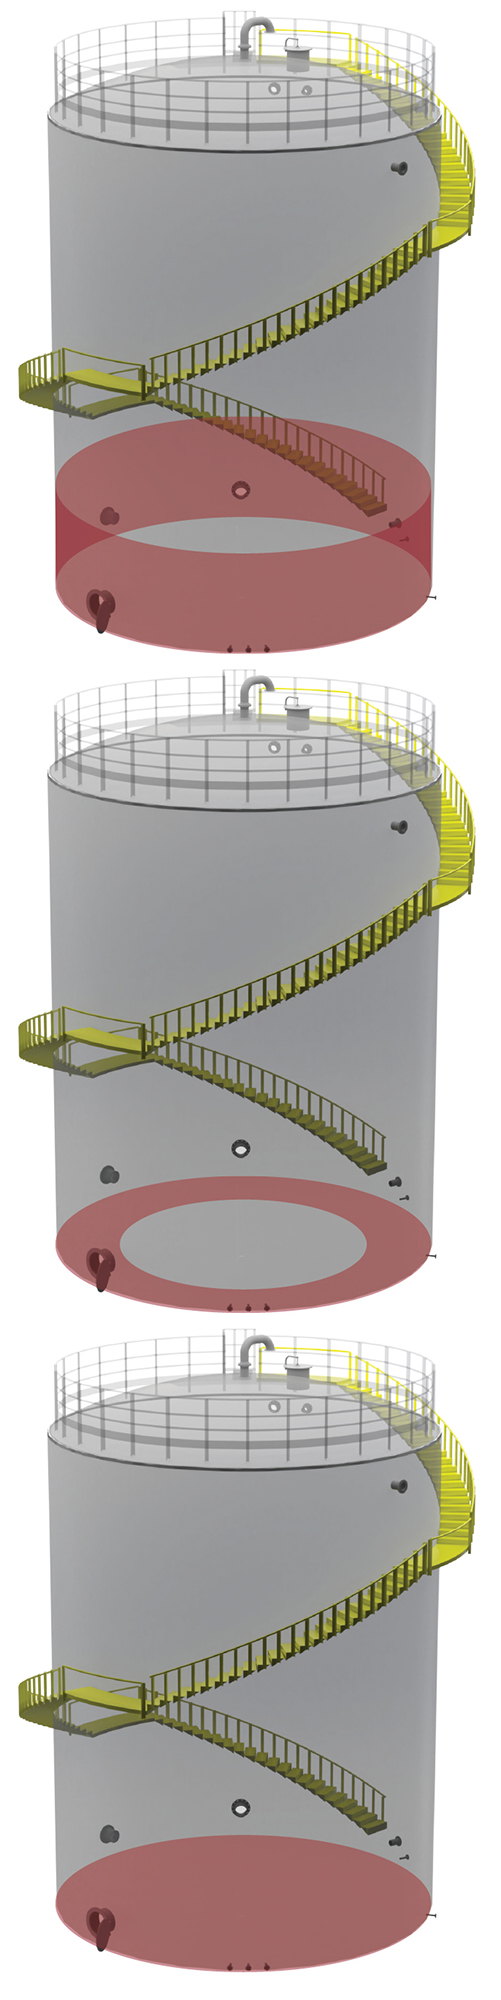
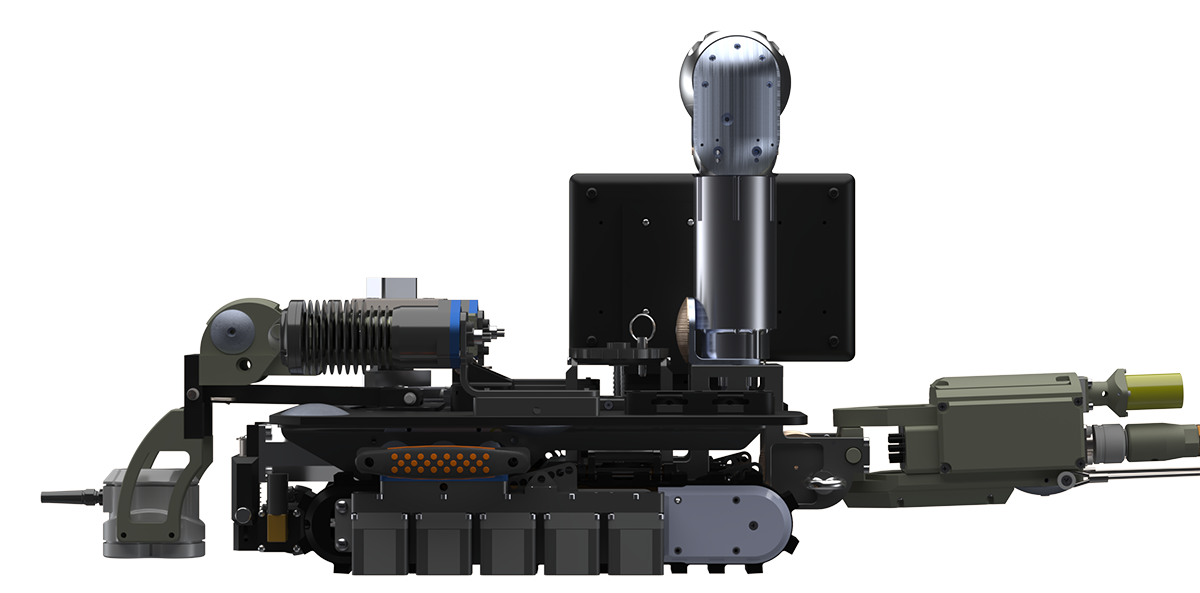
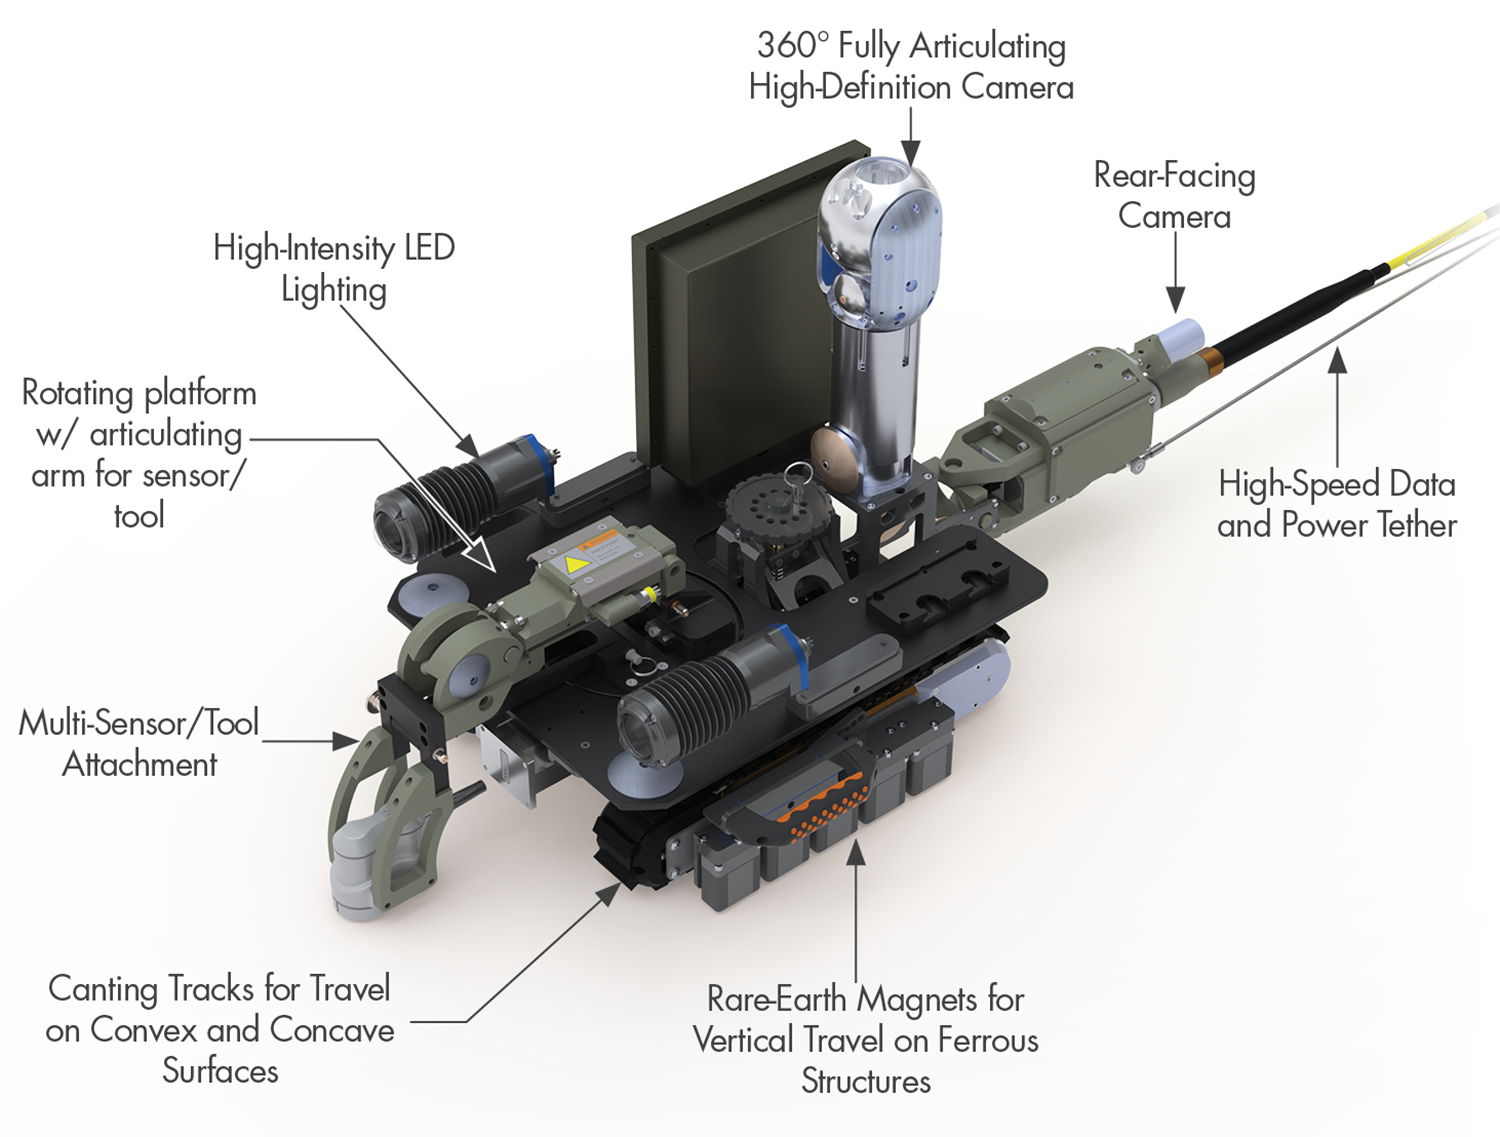
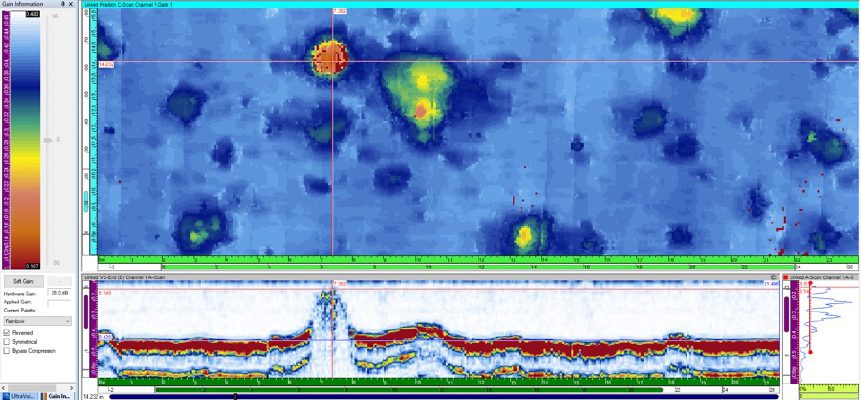
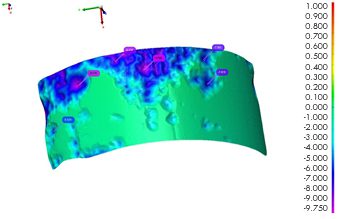
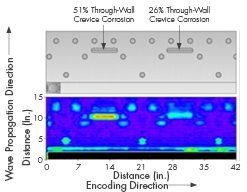
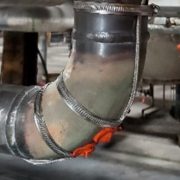
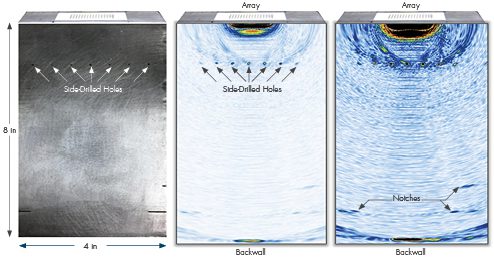
In situations where putting equipment inside the tank is unavoidable, SI has developed a robotic solution that uses a novel technological approach to provide rapid, 100% volumetric coverage with a range of NDE sensors deployed on a relatively basic robotic platform. Rapid, large-area volumetric coverage is obtained by mapping the tank floor with GWPA testing to identify critical areas (Figure 2). These critical areas can then be investigated using high-resolution, non-contact methods, such as electromagnetic acoustic transducers (EMATs) for UT thickness measurements or SI’s dynamic pulsed eddy current technology, SIPEC™, for dirty or lined tanks.

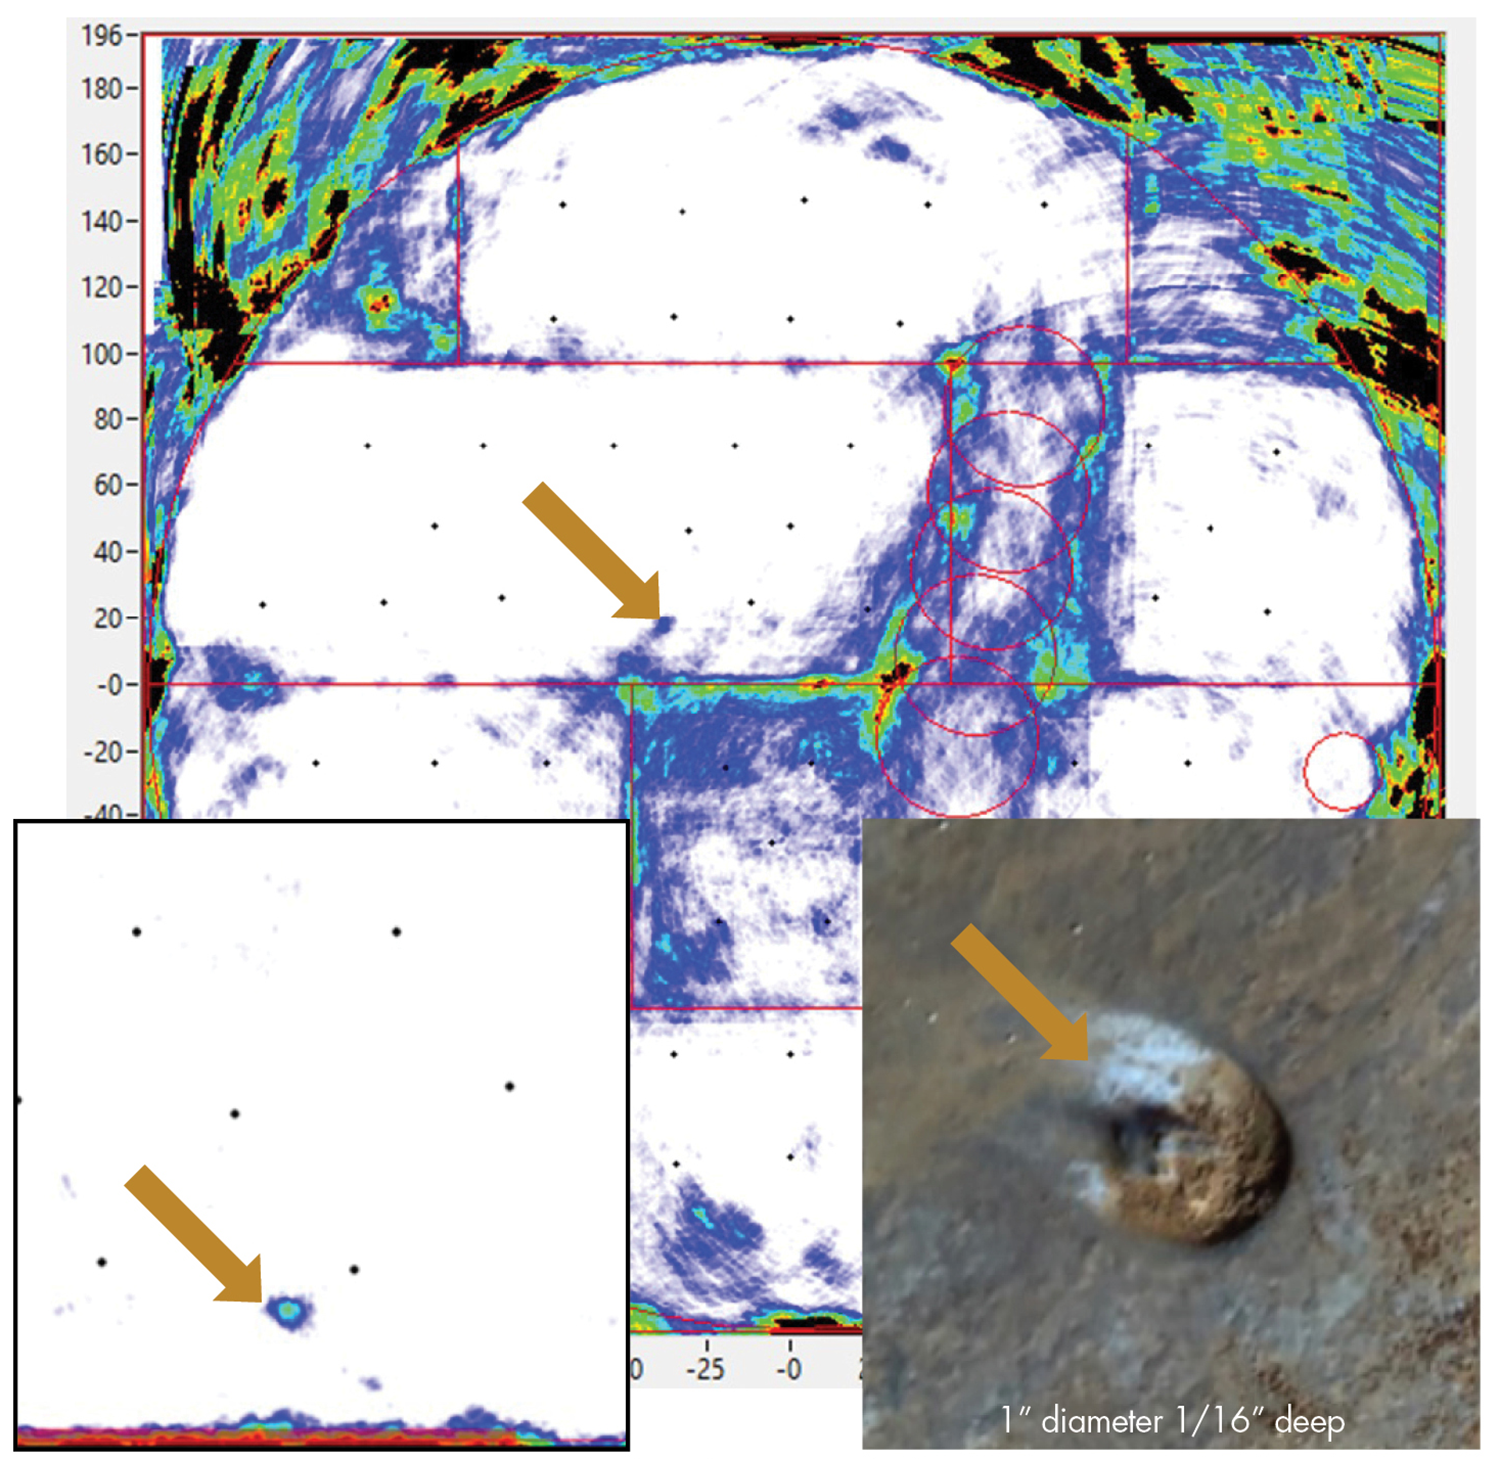
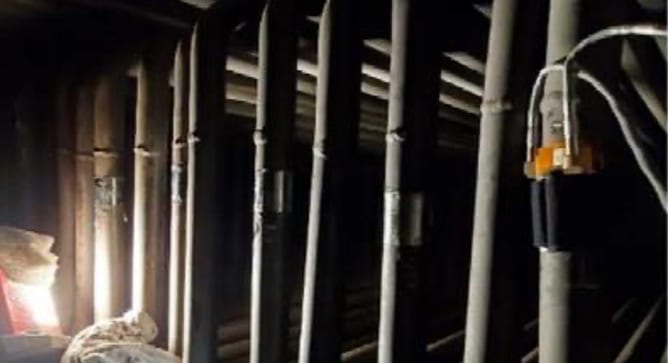
Figure 2. GW Phased Array Tank Floor Inspection

From a deployment perspective, SI’s robotic system is designed to fit through existing tank access points, can scale carbon steel walls, and can quickly switch between a range of sensor types. Additionally, SI has incorporated a proprietary acoustic vehicle positioning system, where sound pulses track the absolute position of the robot at all times, ensuring precision results and the ability to accurately relocate and rescan specific areas for follow-up activities or future inspections. The acoustic positioning system uses a transmitter placed on the robot and a series of receivers placed on the exterior tank wall to track the movement of the robot. With this approach, positioning is not reliant on visual or other optical methods that can be confounded by cloudy, murky, or otherwise opaque liquid and is not subject to encoder error or drift.

Engineering Support Services

Beyond inspection, SI provides integrated engineering support that couples directly with tank inspections. SI’s expertise includes disposition of findings, detailed evaluation of any anomalies, and optional integration with our piping and tank asset management database, MAPPro™. SI engineers are adept at employing detailed FEA models and/or fracture mechanics techniques to assess the acceptability of any observed flaws/defects. For time-critical inspections, engineering handbooks can be developed before the examinations to provide real-time disposition of any findings. Loading inspection results into MAPPro enables risk-ranking utilizing time-proven algorithms, thereby informing future programmatic actions.

Using the advanced deployment and inspection technologies highlighted herein, SI is able to comprehensively inspect and disposition findings from tanks of various sizes while reducing schedule risk and ensuring accurate results.

Tank Inspection NDE Technologies

  • Guided Wave Phased Array (GWPA)
    • Used to rapidly inspect large areas such as a tank floor.
    • Provides 100% volumetric coverage in a minimal amount of time and with minimal surface preparation.
    • Identifies critical areas that should be investigated further using more precise examination technology. This follow-up is completed by switching probe heads and conducting targeted quantitative exams.
    • Can also be applied from the chime plate on the tank exterior to examine the outer annulus of the tank floor.
  • Electromagnetic Acoustic Transducer (EMAT) Ultrasonic Thickness Testing
    • A non-contact (up to 0.25 inches of liftoff) volumetric examination that provides quantitative wall thickness for either carbon or stainless-steel tanks.
    • Electromagnetic sensors generate UT for thickness measurements and are electromagnetically coupled, thus eliminating the need for couplant or close contact with the test surface.
    • This type of testing is helpful for corrosion mapping where surface prep is not possible or costly or if there is a coating/liner present; additionally, it allows for remote robotic inspections, including those where the probe is submerged.
  • SIPEC™ Electromagnetic Thickness Testing
    • Proprietary non-contact volumetric examination that works through internal liners and sediment (up to several inches) targeting either carbon or stainless steel.
    • Employs a proprietary dynamic pulsed eddy current measurement technique for rapid scanning.
    • Higher liftoff, lower resolution option when compared to EMAT UT.

Download Volume 55

News and Views, Volume 54 | Advanced NDE for Hydroelectric Penstock Inspection

By:  Jason Van Velsor and Jeff Milligan

At SI, we regularly combine advanced NDE inspections with fitness for service evaluations to provide value-added solutions for our clients.

Hydroelectric power plants harness two of the most powerful forces on earth, water and gravity.  The integrity of the penstocks that flow water to and away from the turbines in these plants is paramount to safe operation and the safety of the surrounding population. With many hydro plants approaching 100 years of service, critical issues can arise with these penstocks, which may have little to no fabrication documentation, may have significant fabrication imperfections, and may have significant accumulated damage from the environment and many years of service.

Our talented, highly experienced NDE staff can complete in-depth hydroelectric penstock inspections for our clients, providing peace of mind that their assets are safe to continue operating long into the future.

Example of Inspections Completed By SI

Figure 1. (Top) C-Scan image of corrosion spots on the ID of a penstock with the color scheme relative to material thickness; (Bottom) B-Scan image showing the thinnest thickness reading, 0.140 inch.

Phased Array Ultrasonic (PAUT) Corrosion Mapping of Penstocks

SI works with hydroelectric utility companies to provide detailed thickness measurements on specific areas of penstocks. Phased array ultrasonic corrosion mapping provides hundreds of thousands of thickness readings that can produce a detailed image of the inside surface of a penstock, which may have experienced corrosion or erosion that limits penstock life. This highly detailed scan produces the data required for accurate Fitness for Service (FFS) calculations. PAUT corrosion mapping can be performed from the outside diameter of penstocks that are above ground to detect internal wall thinning, or it can be performed from the inside of a penstock, as long as safe access and confined space requirements are met.  An example of the phased array ultrasonic data can be seen in Figure 1 Thickness measurement values, often taken every 0.04 inch (1 mm) along the scan area can be saved and exported using industry standard formats (e.g., CSV, excel, etc.) to support further statistical analysis of the ultrasonic data.

Corrosion Surface Profilometry

Figure 2. Laser scan image of corrosion on the OD of a penstock with pit depths identified.

For a pitted or corroded surface that is accessible to an inspector (ID or OD), the use of a laser profilometry device can be a valuable tool to map and depth size corrosion.  Conventional pit gauge measurement of corrosion on penstock surfaces can be a time consuming and inaccurate process.  The results rely heavily on the experience of the technician as well as the surrounding surface condition.  A more efficient and accurate method is to create an exact image of the surface using a handheld laser scanner.  The laser scanning process is very fast and the results can be displayed as a 3D surface or unrolled to a 2D view.  Reconstruction of the surface is real-time, with color coding used to provide a visual relevance for material loss.  Off-line analysis can be used to make discrete readings of wall loss, or the full map data file can be exported using standard file formats to allow other subsequent analysis to be conducted.

Short Range Guided Wave Technique to Inspect Riveted Joints for Crevice Corrosion

Figure 3. Drawing of potential location for crevice corrosion on a riveted lap-joint.

Figure 4. Mock-up drawing and actual examination data from SR-GWT test.

Some penstocks with riveted joints may suffer from crevice corrosion due to the construction geometry of the riveted lap joints.  The lap-joint area is generally covered in concrete and buried so the external surface is not easily accessible. The concrete can disbond over time and water collects and runs along the crevice of the plate and butt strap, causing corrosion. The area of crevice corrosion may not be assessed from the internal surface with traditional ultrasonic methods due to the obstruction from the internal butt strap, therefore SI has developed a short range guided wave testing (SR-GWT) technique to inspect for this crevice corrosion. Figure 3 shows an image to help visualize the issue.  For this technique electromagnetic acoustic transducers (EMAT) are utilized to propagate sound waves along the volume of the penstock plate to detect a change in the cross-sectional area.  Figure 4 shows an example of inspection data that was collected on a calibration plate to prove this technique.

Lap-Welded Longitudinal Seam Inspection

Our staff can complete lap-welded seam identification and inspections. Lap-welded or forge-weld longitudinal seam pipes and penstocks were manufactured in the 1920s (Figure 5). Oftentimes, little to no fabrication documentation exists that will tell a hydroelectric utility if their penstock cans were made with lap-welded seams. SI developed a phased array ultrasonic examination technique to identify areas of lap-welded seams and look for lack of fusion and service damage.

SI developed two different PAUT techniques to identify and examine lap-welded penstocks. A refracted shear wave technique is preferred for ID-connected indications, while a longitudinal wave technique produces sound that is more perpendicular to the weld bond line of the lap-welded joint.  Figure 6 shows PAUT scan data along with an explanation of typical features from three different lap-welded seam examinations.

ID/OD Girth Weld Inspection

Figure 5. Illustrated cross-section of a lap weld.

Phased array ultrasonic examination of girth welds is also a common inspection for hydro penstocks. SI’s vast experience inspecting high energy piping systems and pressure vessels translate perfectly to penstock girth weld applications. SI uses ultrasonic software simulation programs to create scan plans that calculate the necessary beam angles and focusing to ensure 100% weld coverage during a PAUT examination. Encoding PAUT data with an automated, semi-automated, or manual encoding device allows for off-line analysis and a permanent record of inspection data. SI also has the ability to create custom scanners, probes, and wedges, when required for difficult inspection applications.  The advanced NDE equipment and experience of SI is unmatched. 

Figure 6. PAUT scans at 0° incidence (image is analogous to a cross-section of the weld) from hammer-welded pipe showing seam indications (labelled “1”) increased wall thickness at the seam (labelled “2”), and relatively clean areas adjacent to the seam (labelled “3”). The top image and center images show indications from the bond line (likely indicating lack-of-fusion), while the bottom image shows no indications from the bond line. Note that the base material on the left and right ends of the image shows dense areas of small indications, likely attributable to numerous impurities and inclusions in low-quality skelp from which this pipe was manufactured.

SI Can Help

The situations discussed previously demonstrate solutions that SI has developed for hydroelectric penstocks. With our extensive expertise, SI can work with our clients to develop and execute inspection solutions that are customized to their specific needs and provide various engineering analyses based on the examination results.


Get News & Views, Volume 54

News & Views, Volume 53 | Phased Array Ultrasonic Testing (PAUT) Monitoring with Ultrasonic Thick-Film Arrays

Traditional nondestructive examination (NDE) activities are planned based on hours of service, number of load cycles, time elapsed since previous inspections, or after the emergence of clear and obvious damage in a component. While engineering judgment and risk analysis can, and should, be used to prioritize inspections, these prioritizations are not based on the actual physical condition of the component or material it is constructed from but on precursory conditions that may or may not lead to eventual damage. Alternatively, continuous monitoring approaches can facilitate advanced planning and the optimization of Operations and Maintenance (O&M) spending by enabling the prioritization of inspections based on a component’s actual current condition. Furthermore, continuous monitoring enables earlier detection, which allows the extension of the component’s remaining useful life through modified operation. 

SI’s recent advances with thick-film are breakthrough technologies for long-term monitoring and imaging of crack growth in critical components.

Figure 1. Installed thick-film UT sensors for thickness monitoring of elbows.

Given the trend of fewer on-site resources and tighter O&M budgets, the energy industry has a strong motivation to progress toward condition-based inspection and maintenance. To facilitate this evolution in asset management strategy, new monitoring sensor technologies are needed, ones that provide meaningful monitoring data directly correlated to the condition of the material or asset. To support this need Structural Integrity has developed a novel thick-film ultrasonic sensor solution. Initially developed for basic applications, such as thickness monitoring, SI’s recent advances with this technology make long-term monitoring and imaging of crack growth in critical components possible.

BACKGROUND
Ultrasonic thick-films are comprised of a piezoelectric ceramic coating that is deposited on the surface of the component that will be monitored. A conductive layer is then placed over the ceramic layer, and the ceramic layer deforms when an electric potential is applied across the film. When a sinusoidal excitation pulse in the ultrasonic frequency range is applied across the film, the vibration of the film is transferred into the test component as an ultrasonic stress wave.   

Structural Integrity initially developed our thick-film ultrasonic sensors for real-time thickness monitoring and has demonstrated the performance and longevity of this technology through laboratory testing and installation in industrial power plant environments, as seen in the photograph in Figure 1, where the sensors have been installed on multiple high-temperature piping components that are susceptible to wall thinning from erosion. In this application, the sensors are fabricated directly on the pipe’s external surface, covered with a protective coating, and then covered with the original piping insulation. Following installation, data can either be collected and transferred automatically using an installed data acquisition instrument, or a connection panel can be installed that permits users to acquire data periodically using a traditional off-the-shelf ultrasonic instrument. Example ultrasonic datasets are shown in Figure 2.

Figure 2. Ultrasonic datasets from an installed thick-film UT sensor at two different points in time.

TECHNOLOGY ADVANCEMENTS
Recently, SI has demonstrated the ability to create thick-film sensors with complex element arrays that can be individually controlled to steer and focus the sound field, as with traditional phased-array ultrasonic testing (PAUT). Moreover, data from individual array elements can be acquired and post-processed using full-matrix capture (FMC) techniques. FMC is a data acquisition technique where all elements in the array are used to both transmit and receive ultrasonic waves. The result is a large data matrix that can be used for further processing with various post-processing techniques. Compared to more traditional active focusing, FMC is well-suited for a fixed transducer array, as scanning speed is not a concern. Another advantage is that the electronics needed for data acquisition can be simplified – requiring only a single pulsing channel.

A thick-film Linear-Phased Array (LPA) installed on a standard calibration block is shown in Figure 3. The two images shown on the right were generated using the Total Focusing Method (TFM) post-processing algorithm, with the image on the far right having an adjusted color scale to highlight the imaging of the notches toward the bottom of the calibration block. TFM is an amplitude-based image reconstruction algorithm where the A-scans from the FMC dataset are used to synthetically focus on every point in a defined region of interest.

Figure 3. FMC TFM results from a thick-film linear phased array installed on a calibration block.

Using other information from the FMC dataset, such as the phase of the waveforms, has proven to be beneficial in certain cases. At each focal point in the region of interest, a large phase coherence among all the waveforms can be indicative of a focused reflector. This can then be applied to the TFM image at each focal point as a weighting factor (also known as the Phase Coherence Factor (PCF)) to improve the signal-to-noise ratio. 

Figures 4 and 5 illustrate the results of applying the phase coherence imaging technique to the FMC datasets collected with thick film transducer arrays. The sample is a section of high-energy piping approximately 1.7 inches thick with cracking at various positions along a girth weld. The sample has a counterbore with ID-initiated cracks up to approximately 0.5 inches in length coming from the taper of the counterbore. The thick film transducer arrays were located at different positions along the weld.

SUMMARY
The energy industry is moving away from traditional scheduled-based planning for inspection and maintenance activities and toward “smart plant” concepts that rely more heavily on data correlated to actual component conditions. To accomplish this, there is a need for new and novel monitoring technologies that are both unobtrusive and able to withstand the harsh conditions of industrial facilities. Collecting robust and meaningful monitoring data will be critical in ensuring that safety and asset reliability are maintained and even improved. Structural Integrity’s thick-film UT technology has been developed to achieve this goal and continues to evolve for higher-temperature components and more advanced applications. We are ready to support a variety of in-field applications, contact one of SI’s experts if you have questions or a potential application that could benefit from installed thick-film UT sensors.

Figure 4. Phase coherence imaging result from a thick film transducer array on a cracked weld sample.

Figure 5. Phase coherence imaging result from a thick film transducer array on a cracked weld sample.

News & Views, Volume 51 | Drone Inspections

SI EXPANDED CAPABILITIES

By:  Jason Van Velsor and Robert Chambers

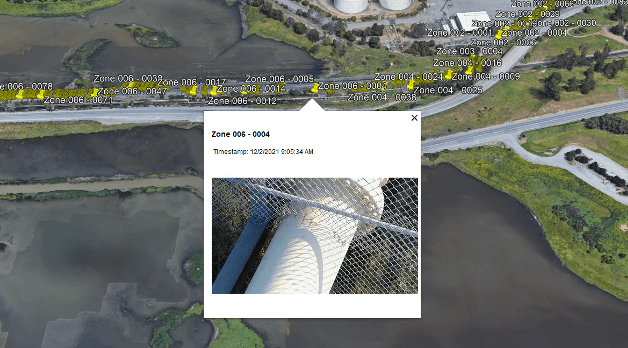
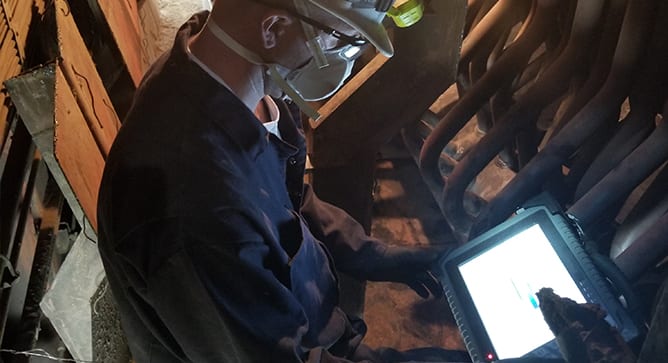
Structural Integrity (SI) has recently added drones to our toolbox of inspection equipment. Using drones, inspectors are able to complete visual inspections safely and more efficiently. Applications of drones for visual inspections include plant and piping walkdowns, structural inspections and atmospheric corrosion monitoring (ACM) of exposed pipeline.

Figure 1. Drone image of a dent on an elevated section of pipeline

Pipe hanger walkdowns at fossil and combined cycle plants are part of a routine inspection process. During these inspections, the inspector is required to view and mark down pipe hanger positions and assess their condition. While some hangers provide easy access for the inspector, this is not always the case. Some of these may be located in elevated positions that require the plant to build out scaffolding, which not only increases the cost, but also can put the inspector at risk when working at elevation. With the use of drones, the inspector can fly up to the pipe hangers from a safe location and get a live high-resolution video feed from the camera mounted on the drone. Saving pictures and the video footage can also allow the inspector to go back and review the footage at a later time.

ACM is another example where drones have proven to be a useful tool. ACM inspections of outdoor above ground pipelines are typically done by

walking down the pipeline and recording any signs of atmospheric corrosion. There are many occasions where the pipeline will be elevated or cross over rivers and railroads, requiring scaffolding or fall protection. By using a drone to fly along the pipeline, the inspection can be completed much more efficiently and safely. In situations where a GPS signal is available, such as outdoor pipeline inspections, the GPS coordinates can be saved with each photo. Custom SI-developed software can then automatically compile the acquired images and create a KML file to be viewed in Google Earth, allowing the client to get an overview of the inspection results. 

Figure 2. Google Earth view of image locations

Moving forward, SI plans to utilize these drones for more than just visual inspections. Possible applications could include using drones to perform ultrasonic thickness testing or Structural Integrity Pulsed Eddy Current (SIPEC™) examinations. All of SI’s pilots in command hold valid FAA Part 107 certificates and pilot registered drones.

Get News & Views, Volume 51

News & Views, Volume 51 | High Temperature Ultrasonic Thickness Monitoring

TECHNOLOGY INNOVATION – THICK FILM SENSORS

By:  Jason Van Velsor and Robert Chambers

Figure 1 – Photograph of an ultrasonic thick-film array for monitoring wall-thickness over a critical area of a component.

The ability to continuously monitor component thickness at high temperatures has many benefits in the power generation industry, as well as many other industries. Most significantly, it enables condition-based inspection and maintenance, as opposed to schedule-based, which assists plant management optimizing operations and maintenance budgets and streamlining outage schedules. Furthermore, it can assist with the early identification of potential issues, which may be used to further optimize plant operations and provides ample time for contingency and repair planning.

Over the last several years, Structural Integrity has been working on the development of a real-time thickness monitoring technology that utilizes robust, unobtrusive, ultrasonic thick-film sensor technology that is enabling continuous operation at temperatures up to 800°F. Figure 1 shows a photograph of an installed ultrasonic thick-film array, illustrating the low-profile, surface-conforming nature of the sensor technology. The current version of this sensor technology has been demonstrated to operate continuously for over two years at temperatures up to 800°F, as seen in the plot in Figure 2. These sensors are now offered as part of SI’s SIIQ™ intelligent monitoring system.


ultrasonic signal amplitude

Figure 2 – A plot of ultrasonic signal amplitude over time for a sensor operating continuously at an atmospheric and component temperature of 800°F.

In addition to significant laboratory testing, the installation, performance, and longevity of Structural Integrity’s thick-film ultrasonic sensor technology has been demonstrated in actual operating power plant conditions, as seen in the photograph in Figure 3, where the sensors have been installed on multiple high-temperature piping components that are susceptible to wall thinning from erosion. In this application, the sensors are fabricated directly on the external surface of the pipe, covered with a protective coating, and then covered with the original piping insulation. Following installation, data can either be collected and transferred automatically using an installed data acquisition instrument, or a connection panel can be installed that permits users to periodically acquire data using a traditional off-the-shelf ultrasonic instrument.

Figure 4 shows two sets of ultrasonic data that were acquired approximately eight months apart at an operating power plant. The first data set was acquired at the time of sensor installation and the second data set was acquired after approximately eight months of typical cycling, with temperatures reaching up to ~500°F. Based on the observed change in the time-of-flight between the multiple backwall echoes observed in the signals, it is possible to determine that there has been approximately 0.005 inches of wall loss over the 8-month period. Accurately quantifying such as small loss in wall thickness can often provide meaningful insight into plant operations and processes, can provide an early indication of possible issues, and is only possible when using installed sensors.

Other potential applications of Structural Integrity’s ultrasonic thick-film sensor technology include the following:

  • Real-time thickness monitoring
    • Flow Accelerated Corrosion (FAC)
    • Erosion / Corrosion
  • Crack Monitoring
    • Real-time PAUT
    • Full Matrix Capture
    • Critical Area Monitoring
  • Other Applications
    • Bolt Monitoring
    • Guided Wave Monitoring

In addition to novel sensor technologies to generate data, Structural Integrity offers customizable asset integrity management solutions, as part of the SIIQ platform, such as PlantTrackª, for storing and managing critical data. Many of these solutions are able to connect with plant historians to gather additional data that feed our engineering-based analytical algorithms, which assist in converting data into actionable information regarding plant assets. These algorithms are based on decades of engineering consulting and assessment experience in the power generation industry.

Reach out to one of our NDE experts to learn more about SI’s cutting-edge thick-film UT technology.

Figure 3 – Photograph showing Structural Integrity’s thick-film ultrasonic sensor technology installed on two high-temperature piping elbows that are susceptible to thinning from erosion.


Ultrasonic waveforms acquired approximately 8 months

Figure 4 – Ultrasonic waveforms acquired approximately 8 months apart showing 0.005 inches of wall loss at the sensor location over this period.


Get News & Views, Volume 51

News & Views, Volume 49 | Rapid Assessment of Boiler Tubes Using Guided Wave Testing

News & Views, Volume 49 | Rapid Assessment of Boiler Tubes Using Guided Wave TestingBy:  Jason Ven Velsor, Roger Royer, and Ben Ruchte

Tubing in conventional boilers and heat-recovery steam generators (HRSGs) can be subject to various damage mechanisms.  Under-deposit corrosion (UDC) mechanisms have wreaked havoc on conventional units for the past 40-50 years and have similarly worked their way into the more prevalent combined cycle facilities that employ HRSGs.  Water chemistry, various operational transients, extended outage periods, etc. all play a detrimental role with regards to damage development (UDC, flow-accelerated corrosion, pitting, etc.).

READ MORE

News & Views, Volume 48 | SI Field Service Quality and Efficiency Solutions

By:  Robert Chambers and Trey RippyNews & View, Volume 48 | SI Field Service Quality and Efficiency Solutions

To help meet demanding outage schedules and stay within lean operation and maintenance budgets, Structural Integrity Associates, Inc. (SI) has implemented several new field data collection and analysis tools that enable delivery of a higher-quality final inspection product in a more efficient manner. These include customized software tools for streamlining the NDE data acquisition, analysis, and reporting processes. Moving forward, these tools will reduce time-on-pipe for inspections, as well as the associated analysis and reporting time.

For large inspection scopes, collecting, tagging, managing, transferring, and documenting data can be a very labor-intensive process with opportunities for human performance errors. While inspection instruments and analysis software typically have built-in reporting capabilities, these tend to be very general so they can be applied to a wide variety of applications. This can make it cumbersome to tailor these features to a specific application.

READ MORE


News & View, Volume 47 | Surface Preparation – A Pivotal Step in the Inspection Process

By:  Ben Ruchte, Steve Gressler, and Clark McDonaldNews & View, Volume 47 | Surface Preparation – A Pivotal Step in the Inspection Process

Properly inspecting plant piping and components for service damage is an integral part of proper asset management.  High energy systems constructed in accordance with ASME codes require appropriate inspections that are based on established industry practices, such as implementation of complimentary and non-destructive examination (NDE) methods that are best suited for detecting the types of damage expected within the system.  In any instance where NDE is used to target service damage, it is desirable to perform high quality inspections while at the same time optimizing inspection efficiency in light of the need to return the unit to service.  This concept is universally applicable to high energy piping, tubing, headers, valves, turbines, and various other power and industrial systems and components.

READ MORE

News & Views, Volume 46 | Application of Probabilistic Flaw Tolerance Evaluation Optimizing NDE Inspection Requirements

By:  Christopher Lohse

News & View, Volume 46 | Application of Probabilistic Flaw Tolerance Evaluation Optimizing NDE Inspection Requirements
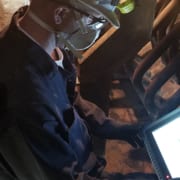
There have been several industry initiatives to support optimization of examination requirements for various items/components (both Class 1 and Class 2 components) in lieu of the requirements in the ASME Code, Section XI.  The ultimate objective of these initiatives is to optimize the examination requirements (through examination frequency reduction, examination scope reduction, or both) while maintaining safe and reliable plant operation.  There are various examples of examination optimization for both boiling water reactors (BWRs) and pressurized water reactors (PWRs).  Each of these technical bases for examination optimization relies on a combination of items.  The prior technical bases have relied on: (1) operating experience and prior examination results as well as (2) some form of deterministic and/or probabilistic fracture mechanics.   For BWRs, the two main technical bases that are used are BWRVIP-05 and BWRVIP-108.  These technical bases provide the justification for scope reduction for RPV circumferential welds, nozzle-to-shell welds, and nozzle inner radius sections.  For PWRs, the main technical basis for RPV welds is WCAP-16168.  These technical bases are for the RPV welds of BWRs and PWRs which represent just a small subset of the examinations required by the ASME Code, Section XI.  Therefore, the industry is evaluating whether technical bases can be optimized for other components requiring examinations. 

READ MORE

News & Views, Volume 46 | Multi-discipline Solution for Pressure Vessel Asset Management

By:  David Segletes and Dan Peters

One of the strengths of the Structural Integrity Associates (SI) team lies in the diversity of the skills and capabilities in the organization. Sure, SI can perform inspection, analysis, design, metallurgy, failure investigations, risk assessments, and project management, but one of the real values of working with SI is when all of those aspects are brought together to solve an issue.

News & View, Volume 46 | Multi-discipline Solution for Pressure Vessel Asset Management
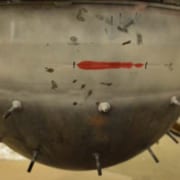
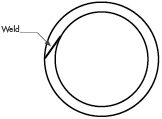
Recently, a client approached SI after finding a through-wall flaw in an autoclave at the head-to-shell weld as indicated by a visible dye liquid penetrant examination (Figure 1). The autoclave was one of eight similar vessels used for processing the client’s product. Three of the autoclaves are identical in construction to the flawed autoclave and operate with similar process conditions. Remote visual examination by the client indicated that all four autoclaves had similar observations at the inside of the head-to-shell weld, but only one was leaking. The remaining four autoclaves are smaller and are used infrequently. The initial call from the client was for SI to provide emergent support for inspection of the three autoclaves identical to the leaking one to meet production demands. SI responded quickly and examined all four autoclaves using a manual phased array ultra-sonic technique (PAUT) from the exterior of the vessel. The manual PAUT examination provided excellent coverage of the weld region and visualization of the through wall flaw (Figure 2).

READ MORE