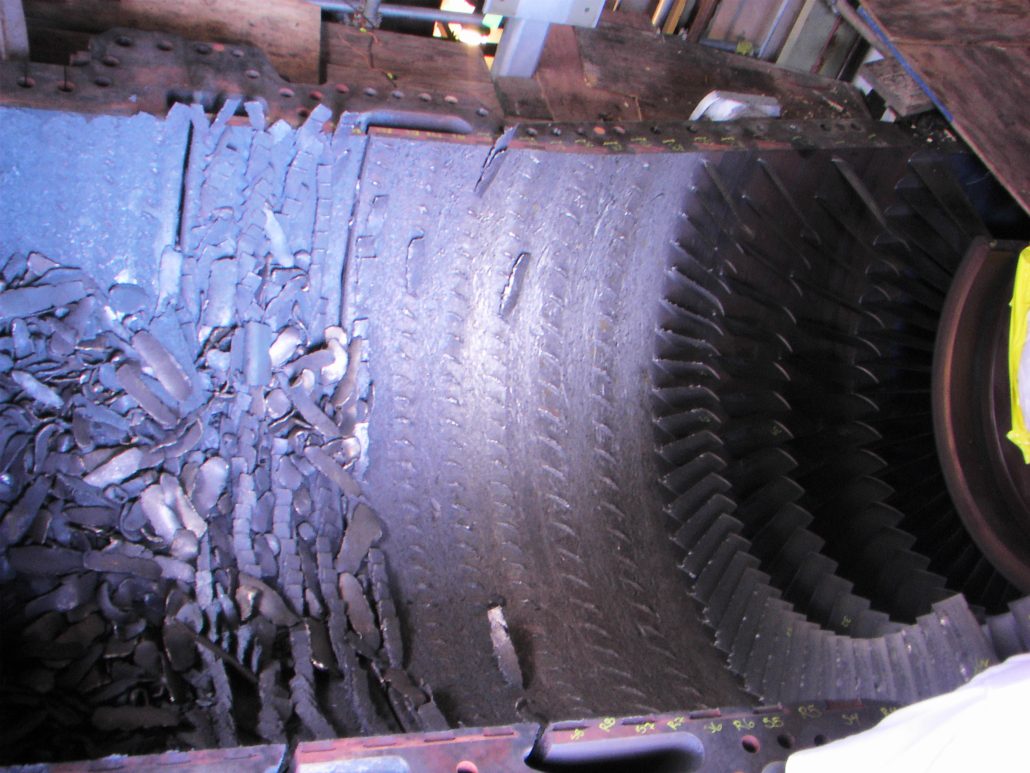
Figure 1. Lower compressor casing after large forward blade liberation, causing a forced outage and catastrophic damage to aft components.
COMPONENT ASSESSMENT AND ANALYSIS
By John Molloy
Structural Integrity (SI) has decades of experience dealing with compressor degradation’s short-term and long-term effects, forced outages, and unforeseen costs regarding Combustion Turbine (CT) compressor hygiene. The inlet package and compressor condition can strongly influence unit performance, efficiency, reliability, risk, and maintenance costs.Controlling what enters the inlet and mitigating the effects of accumulated foreign material can significantly impact O&M activities and costs.
Additionally, in the new paradigm of cyclical operation and potentially longer downtime between operational periods, additional considerations and actions are incumbent upon O&M to prevent irreversible damage to various CT flow path components (compressor, rotor, etc).
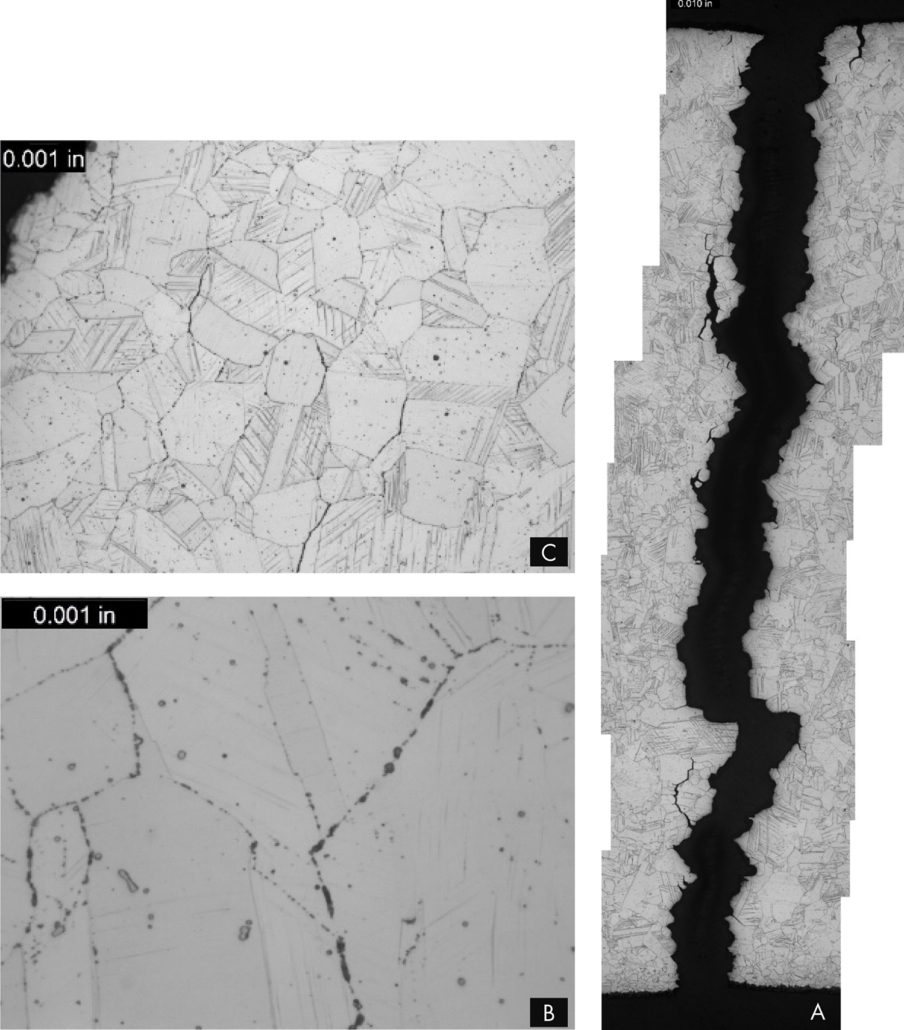
In the 51st edition of News & Views, we discussed the CT compressor hygiene regarding component longevity. This follow-up article will dive into the assessments and analyses.
SI is pleased to offer a comprehensive suite of inspections, analyses, and O&M recommendations to help mitigate these debits to reliable, profitable, and safe operation.
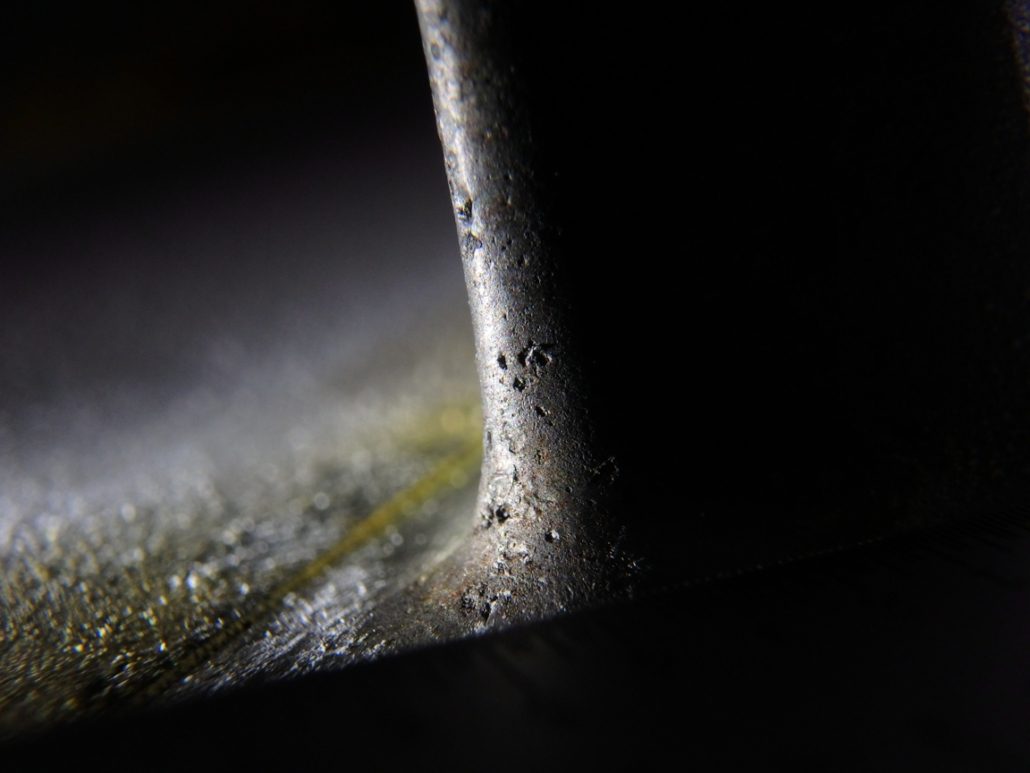
Figure 2. Forward compressor blades with corrosion pitting on the leading edge, platform radius, providing nucleation sites for corrosion fatigue and cracking.
Inlet Package and Forward Compressor Detailed Site Survey
The inlet package and forward compressor site survey is a detailed visual inspection of the inlet filter house/inlet ducting assembly. The inspection allows for documenting potential sources of foreign objects, evidence of sealing issues (floor/wall/roof construction, penetrations, and filter seating), pooling water, corrosion, cracks, cleanliness, and contaminant/debris presence.
The in-depth inspection also examines:
Water injection/misting systems for leaks/contaminant accumulation
Bearing region and compressor leak entry passages for contaminants/debris
Pre-filter deposits/debris collection to determine local environmental loading conditions and corrodents
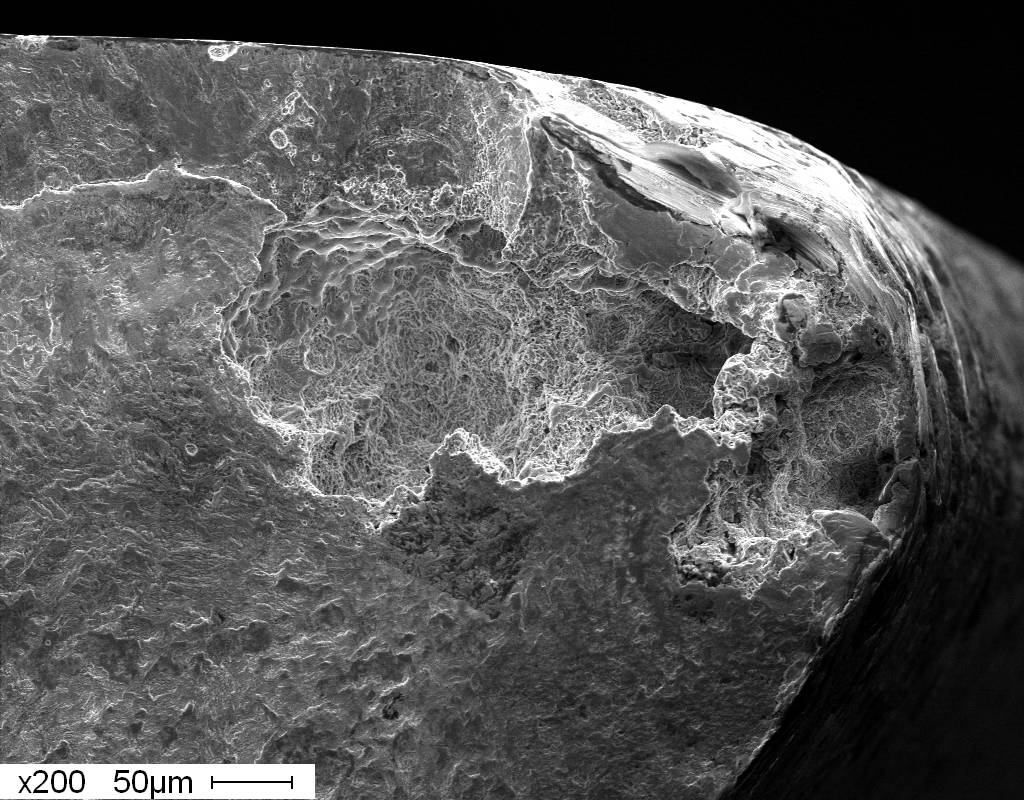
Figure 3. Pitting on compressor blade.
The SI team additionally collects Inlet Guide Vane (IGV) and forward blade, stator vane, rotor, and carrier deposits/residues to establish the presence of contaminants and or corrodents on the compressor, and compares this to the finding in the pre-filters to establish the efficacy of the filtration system. Particular attention is given to the compressor’s lower half, which is usually the area most affected. Photographic documentation of the typical forward compressor (IGV/R0/S0/R1) pitting conditions is completed using a macro lens (Figure 3). In the final step of the survey, the team performs a mold replication on typical pitting and leading edge (LE) erosion.
Data Collection, Analysis, and Review
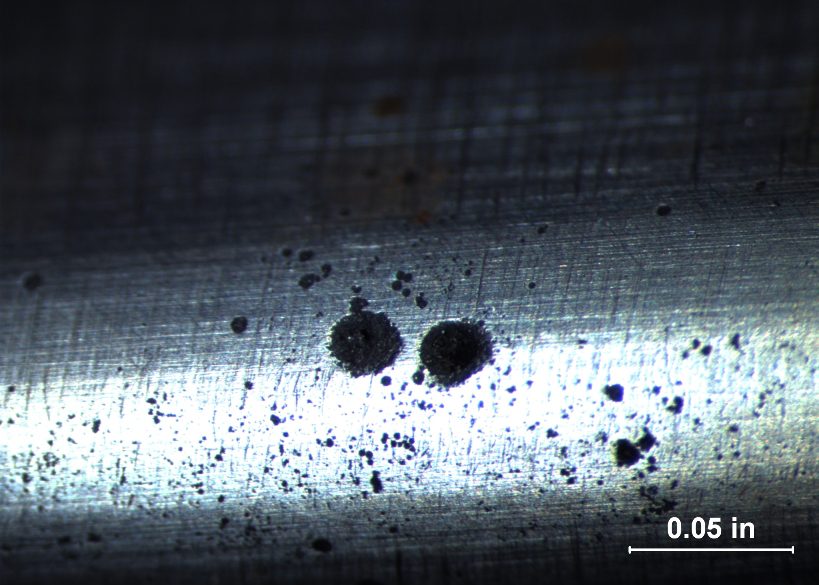
Figure 4. Leading edge chloride pitting and fracture on a vane.
During the compressor hygiene testing and analyses, there are several areas where data can be collected. This includes ambient and unit flow path humidity trends, ambient and CT inlet temperature/dewpoint, water injection operation, compressor performance, and an annual borescope inspection.
Other data elements potentially collected or reviewed include water wash frequency, duration, and water wash quality checks consisting of pH and chemistry constituents review of the demineralized water source, water wash solution, and drain. In addition, the IGV calibration report, pollution, contaminant producers, and environmental wind condition survey (drift) can be reviewed if the previous findings merit this effort. Finally, the team correlates the observed pitting locations with known risk profiles for blade/vane excitation. Nodal response stresses can be evaluated for a more detailed assessment.
Laboratory Support
Figure 5. Metallographic cross-section shows leading edge erosion channeling morphology on a forward compressor blade, which facilitates fatigue crack initiation.
SI’s world-class laboratory is leveraged to provide tailored analyses for compressor assessments.
This generally includes:
Inlet prefilter contaminant/debris species analysis
IGV/R0/S0/R1/Wheel/Case surface contamination species analysis
Pitting and/or erosion depth assessment
Blade and vane metallurgical evaluation When parts are available for analysis, the laboratory analyses can provide specific damage mechanisms affecting the components, which allows for better decisions on mitigation strategies. The goal of the assessment and analysis is to close the loop between the on-site unit findings, the operational assessments, to provde the client with best-in-class combustion turbine availability, and performance.
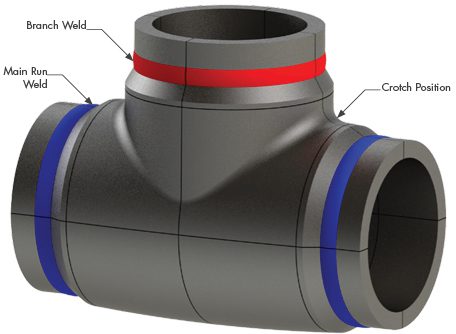
The power generation industry has seen an increasing trend of failures and damage detected in high energy piping tee fittings and the associated girth welds in systems made from grade 91 material (and grades 22 and 92). Failures and evidence of significant creep damage have been detected in less than 100,000 operating hours in many cases and as few as 35,000 operating hours. The issues stem from inadequate reinforcement of the branch leg and/or short tee leg lengths, which can result in tee geometries not suitable for high temperature service even though the tee fittings meet design requirements. If inspections reveal that damage has progressed beyond the point where continued operation can be justified through analytical methods with appropriate confidence and risk tolerance, owners may be faced with a choice of expensive temporary repair or long wait for a replacement. The lead time to procure replacements can be twelve months or greater and additional rigorous engineering assessments to determine size specifications may be required because current code requirements are inadequate in some cases.
Issue Overview Many fabricated tees have failed to withstand short-term exposure to normal operating pressures and temperatures. Analytical assessments have determined that these premature failures can be attributed to a lack of sufficient reinforcement, despite the components in question meeting code design requirements. Additionally, large variations in thickness and diameter and differences in crotch profiles can exist even among similarly sized tee fittings, resulting in uncertainty when trying to extrapolate findings between tees in a system, plant, or fleet. These challenges make it difficult for plant owners to prioritize specific tees for inspection. Experience has shown that there can be significant differences in tee thickness/geometry even among tees produced by the same manufacturer or from one tee crotch to the other. As such, baseline inspections are recommended on all tees operating in the creep regime to comprehensively document their serviceability risk and develop an informed lifecycle management plan.
The applied inspection approach is also adjusted to ensure accurate and reliable detection of damage.
Traditionally, welds have been the most susceptible locations to creep damage in high energy piping systems, so most inspections were solely focused there. For fabricated tee fittings, creep damage has also been detected in the fitting base metal within the crotch region. Localization of creep damage at the crotch region has been validated through finite element analysis based on actual tee geometry. Thus, inspections that were solely focused on girth welds may fail to identify or characterize damage in the tee crotches, providing an incomplete picture of overall condition even for recent inspections.
Damage Initiation The primary driver of damage in tee geometry is from accumulated creep damage resulting from internal pressure stress. The hole in the pipe for the branch leg of the tee leads to elevated stresses that tend to drive axially oriented cracking in the tee crotch. Also, if the attached piping girth welds are close enough to this elevated stress region, these girth welds are at risk for faster rates of creep damage. As opposed to the axially oriented cracking in the tee base material, girth welds tend to initiate circumferentially oriented cracking due to the orientation of the creep weak weld heat-affected zone (HAZ).
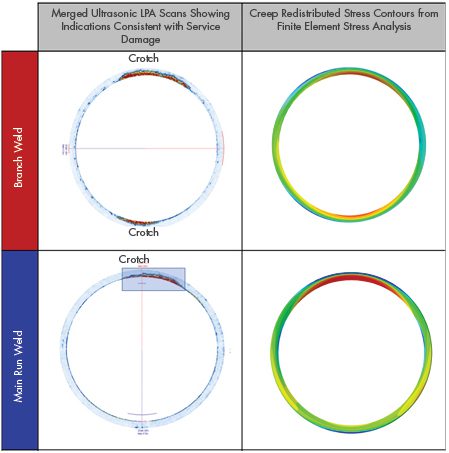
Stresses from piping deadweight and thermal expansion may play a role in biasing damage towards a certain location. However, finite element analyses, ultrasonic inspections of in-service tees, and metallurgical evaluations of cross-sections from ex-service tees have all validated that the distribution of creep damage is consistent with the stress distribution from internal pressure stresses. Figure 2 shows two example ultrasonic phased array scans (left) depicting subsurface indications that are consistent with the creep redistributed FEA stress distribution (right).
Figure 2. Examples of Phased Array Ultrasonic Scans with Indications and Finite Element Color Contour Stress Distribution.
Inspection Considerations SI has performed numerous inspections of tee fittings and associated girth welds. From those efforts, a series of lessons learned and recommended best practices have been developed:
For girth welds, damage can be OD or ID initiated depending on the local geometry and stress state of the component. Damage tends to initiate at the circumferential positions closest to the tee crotches so extra priority should be given toward assessing these areas. The tee side of the weld may include an OD bevel that obstructs UT probe placement on the tee side, but attempts should still be made to scan from both upstream and downstream sides of the weld.
For crotch regions, identified damage tends to be ID or subsurface initiated. Additional surface preparation is required in the crotch to permit ultrasonic scanning. Specialized inspection hardware may be necessary to accurately identify and characterize damage because the complex curvature of the OD crotch surface can limit probe contact area (probe bridging) and the thickness of the tee may make it difficult to observe the ID surface. Specially radiused probes or refracted longitudinal probes may be necessary to enable more accurate scanning of the crotch.
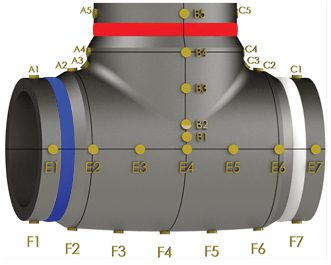
Extensive thickness mapping is recommended to fully document the as-built geometry of the tee and identify whether any ID stress concentrations may be present from manufacturing of the tee. An example tee grid is depicted in Figure 3.
Laser scanning or photogrammetry should be performed to provide the basis for a representative external surface for detailed model creation and finite element analysis on all inspected tees as well as to ensure that the exact location of recorded thicknesses is documented. This scan or set of photographs also provides the basis for a representative external surface for detailed model creation and finite element analysis.
There are multiple documented cases where tees progressed from “No Indications of Service Damage Detected” to macrocracking in far less time than a normally reasonable reinspection interval for girth welds. For this reason, as well as the likelihood that many inspections have been performed without evaluating the tee crotch areas, previously established reinspection intervals may be unreliable, and it is critical for operators with these components to perform an analytical assessment and adjust inspection plans accordingly.
Figure 3. Example of general grid for thickness documentation. Additional thickness mapping should be performed at the crotch regions as well.
Industry Response / EPRI Supplemental Project The operational challenges associated with premature degradation of high energy piping tees have led to significant industry interest in understanding the factors which combine to result in accelerated damage. The Electric Power Research Institute (EPRI) has initiated a supplemental project focused on studying this issue for tees operating in the creep regime. The project members are comprised of numerous utilities along with service providers (including SI), with a goal of summarizing operating experience and establishing reputable guidance for operators.
One of the early observations from the project is that the quality and consistency of inspection data is critical to problem characterization. There have been multiple instances where lack of pre-planning, inadequate surface preparation, and/or failure to compile adequate data and records have challenged the integrity of inspections. To help improve characterization and increase the accuracy of predictive models, SI is working to standardize NDE inspection techniques utilizing a number of components removed from service.
Recommendations for Utilities/Operators Based on SI’s experience with tees operating in the creep regime, it is recommended that operators consider the following guidance:
Perform inspection to document the actual fabricated tee geometry, assess material composition, and determine current condition of the tee and associated girth welds. Ensure that the inspection provider can deliver complete and accurate results in a fashion that informs decision making.
Estimate the creep life in accordance with an appropriate analytical assessment method using actual measured tee geometry and operating data. This step necessitates appropriate material correlations for creep strain rate to determine creep redistributed stresses and appropriate creep rupture correlations for calculations to predict time to crack initiation.
If appropriate based on life estimation results, schedule subsequent condition assessments to look for damage at an appropriate point with respect to estimated damage accumulation and risk tolerance.
Consider reviewing and pre-planning mitigation options prior to scheduling inspections.
Planning should account for the fact that fitness for service assessments may not result in extensive times to through-wall crack propagation. Stresses in the crotch region have been fairly uniform resulting in short remaining life projections.
Planning needs to account for the fact that potentially inadequate tee design requirements are still being addressed by the code committees, and, as such, off-the-shelf replacement tees may also lack reinforcement to ensure appropriate service lifetimes.
https://www.structint.com/wp-content/uploads/2024/07/News-Views-Volume-54-Leaks-in-High-Energy-Piping-Tees-copy.jpg363668Structural Integrityhttps://www.structint.com/wp-content/uploads/2023/05/logo-name-4-930x191-1.pngStructural Integrity2024-07-29 14:02:372024-07-29 14:02:37News and Views, Volume 54 | Leaks in High Energy Piping Tees
Abstract Continued advances in the fields of structural and geotechnical engineering and increasing expectations for fidelity and refinement of seismic analysis models have resulted in a computational bottleneck emerging within the structural design activities for critical infrastructure. The Soil-Structure Interaction (SSI) analysis is key to characterize a realistic seismic response. Unfortunately, this is computationally demanding, given the need to characterize both the dynamic response of the structure and the site. The traditional SSI framework, System for Analysis of Soil Structure Interaction (SASSI), is a trusted analysis approach with decades of precedence. Our proprietary SSI analysis software, SC-SASSI, incorporates modern enhanced solution algorithms into SASSI and takes advantage of state-of-the-art computing, thereby drastically reducing analysis run-time.
The expanded SSI capabilities coded in SC-SASSI effectively eliminate the model size limitations of previous SASSI platforms and allow more accurate and streamlined treatment of behavior that have traditionally been neglected or often treated conservatively.
This article provides a variety of recent project examples highlighting how the enhanced solutions algorithms of SC-SASSI coupled with HPC capabilities have been leveraged, resulting in gains such as improved accuracy, reduced uncertainty, and accelerated schedules.
Introduction Seismic analysis of critical industrial facilities requires the inclusion of the soil into the analysis model to evaluate the influence of the subgrade’s flexibility on the structure’s dynamic behavior. As a result, a soil-structure system is used for this purpose, and the consideration of the soil in the structural behavior is referred to as SSI. Industries other than nuclear also benefit from SSI consideration, both for seismic as well as for other dynamic loading conditions, like machinery vibration. For decades, the SASSI [1] program and its improved derivatives have been an accepted and favored analysis tool for the treatment of seismic SSI effects. With continued advances in the fields of structural and geotechnical engineering, and increasing detail and refinement of analysis models, SASSI has become a computational bottleneck in the design and evaluation of nuclear plant structures, and may not provide the fidelity and detail expected in modern engineering. Compared to the current state of practice for structural finite element (FE) analysis, gross model simplifications are too often perceived to be necessary to ensure reasonable analysis schedules, necessitating numerous assumptions, sensitivity studies, and additional qualitative evaluations to address specific aspects of the real seismic response.
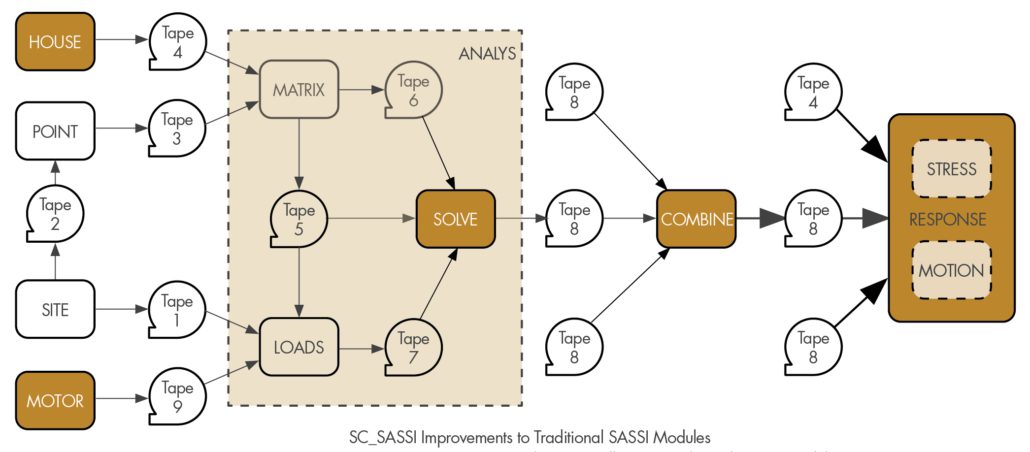
SC-SASSI Enhanced solution algorithms have become available since the development and widespread adoption of the original SASSI framework in the early 1980s. The commercial code, SC-SASSI [2], leverages these algorithms to efficiently take advantage of modern high-performance computing (HPC) with dramatic results. Figure 1 shows a flowchart highlighting some of the SC-SASSI improvements to the traditional SASSI. The gold boxes represent areas of key improvement and include the all-new RESPONSE module, which provides advanced postprocessing and is also a “living” module that continues to grow and adapt to the user’s needs.
Figure 1. Key SC-SASSI Improvements (Shown in Gold) to Traditional SASSI Modules.
Expanded SASSI capabilities via HPC functionality allow two primary advantages that lead to project gains: (1) large increases in permissible model sizes (often measured as a larger number of “interaction nodes”) and (2) drastically reduced analysis run-time. The large models now possibly allow direct treatment of SSI phenomena that previously required gross simplification and/or compromise. Key advantages of the HPC enhancements for large models are the handling of features like deep embedment, high-frequency hazard, structure-soil-structure interaction, and high-fidelity models for coupled stress analysis and seismic analysis. The example outlined below demonstrates some of the gains achieved using large models.
Figure 2. Example Nuclear Power Facility FE Model with Direct Consideration of SSSI.
Structure-Soil-Structure Interaction (SSSI) An ideal example to demonstrate SSSI is that of a Nuclear power generating station. Typically, these sites have multiple structures located near one another, each with components critical to the facility’s safe operation.The SSI behavior of one structure can affect the SSI behavior of an adjacent structure, referred to as structure-soil-structure interaction (SSSI).Direct consideration of SSSI for multiple large structures has been impractical with traditional SASSI, necessitating the use of 2D “slice” SSSI models or “cascade analysis” techniques. These simplifications seek to reduce the size of the model(s) used to evaluate SSSI effects and/or avoid excessive computer run-times. However, they often insert significant inefficiencies (by way of required benchmarking analysis or decoupled, multi-step analyses) and thus remove realism.
In contrast, SASSI with HPC provides efficiency to include multiple structures in the same SSI model, thus directly capturing SSSI effects.In these direct SSSI models, entire multi-building nuclear island complexes have been incorporated into a single analysis run regardless of separation distance, soil properties, foundation depths, etc.The benefits of direct treatment of SSSI effects include: (a) captures full 3D effects of SSSI behavior on adjacent structures and spatially variable amplitude of SSSI effects; (b) captures two-way feedback between adjacent structures; (c) minimizes the number of separate sensitivity study models to generate and maintain; and (d) allows more streamlined calculation of the relative displacements between adjacent structures.
An example multi-building FE model for direct consideration of SSSI effects in SC-SASSI is illustrated in Figure 2. This pressurized water reactor (PWR) complex [3] combines multiple buildings including the containment building, auxiliary building, radwaste building, turbine building, and intake structure into a single model.In addition to capturing traditional SSSI effects, the combined model allowed consideration for partially shared load paths between adjacent structures, shared foundations despite separate super-structures, and relative movement between adjacent structures (to directly assess the potential for building impacts and failure of commodities spanning across seismic joints).
Benefits for Short Computational Times HPC enhancements in SC-SASSI also allow much faster SSI analysis run-times than were possible with traditional SASSI.The rapid analysis now allows more rigorous treatment of considerations that previously were handled via a sensitivity study or by the enveloping response of bounding cases. Key advantages of the HPC enhancements for shortening the computational times are the handling of features like probabilistic SSI analysis, multiple configurations, and/or alternate boundary conditions (like spent fuel installation facilities that may be analyzed under different cask loading configurations), as well as multiple hazard levels (i.e., design basis and beyond design basis earthquakes). The example outlined below demonstrates gains achieved using rapid analysis.
Probabilistic SSI Analysis Probabilistic SSI analysis is advantageous over more traditional deterministic methods since it can directly address the inherent uncertainties related to the seismic input motion, soil and structural material behavior, and modeling assumptions. These uncertainties are directly addressed in the probabilistic SSI through randomization of the seismic input motions as well as soil and structural stiffness and damping. However, a drawback in probabilistic SSI analysis is the number of SSI models that are needed to obtain stable and reliable results, and the perceived computational effort associated with analysis of these various models. In practice, at least 30 SSI models are needed using the Latin Hypercube Sampling (LHS) method for the generation of SSI models. For this reason, many structures have traditionally been either analyzed using a deterministic approach or overly simplified for probabilistic analysis to achieve reasonable computational run-time. The use of HPC can mitigate this drawback by significantly reducing the analysis run-time, thus making it feasible to utilize detailed models for probabilistic analysis.
By covering realistic variability of key inputs like soil, structure, and ground motion, probabilistic SSI analyses provide a range of expected structural response results that allow easy identification of either realistic or conservative responses, according to the objective of the evaluation; this represents a significant advantage over deterministic analysis.
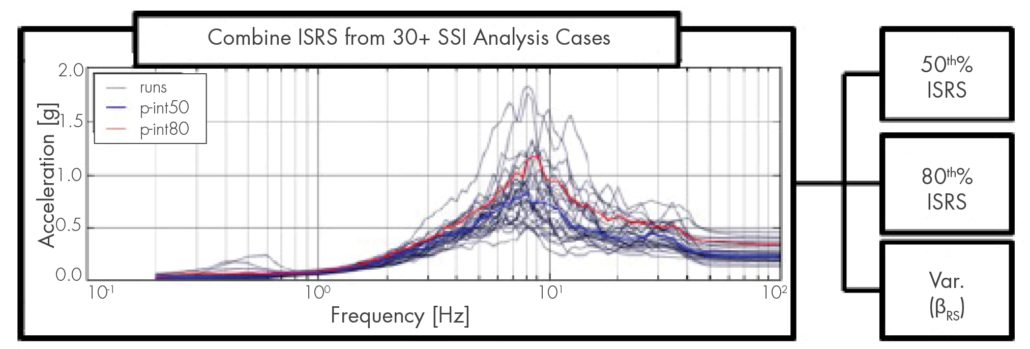
The case described below provides an example where probabilistic SSI analyses were used to obtain realistic responses for the purpose of fragility analysis of structures, systems, and components (SSCs) in a nuclear power plant [3]. Each of the 30 probabilistic SSI cases, which included variation of the soil, structural stiffness, damping, and earthquake ground motion, was run for each model. All 30 SSI cases were run in less than one day for each model. These analyses generated 30 In-Structure Response Spectra (ISRS) for each of the selected locations, and the median and 80th percentile spectra were directly extracted. The response spectra variability (βRS), which often must be assumed in fragility calculations, could be directly and accurately calculated for each set of ISRS. Results post-processing is efficiently automated in SC-SASSI. Figure 3 illustrates each resulting ISRS and their post-processing for a typical location.
Figure 3. Example Calculation of Median and 80th% ISRS from Suite of Probabilistic Results.
Ground Motion Incoherence SC-SASSI offers additional useful features, like ground motion incoherence effects. Ground motion incoherence refers to the spatial variation of the ground motion. In other words, there are differences in the ground motion experienced by two points separated by some distance; the larger the distance, the larger the variability. Considering the effects of ground motion incoherency in SSI analysis enhances the realism of predicted structural response and generally reduces high-frequency response. The relative significance of this refinement depends on several factors, including the foundation input motion’s high-frequency energy content and the foundation footprint’s size. The inclusion of ground motion incoherence in SASSI requires additional computational effort versus coherent ground motion. A common approach in the industry to minimize the additional computational effort is to limit the number of coherency modes in the analysis to some minimum number of modes that can still capture realistic SSI behavior. However, the industry debates on how many modes are sufficient under different conditions. HPC capabilities in SC-SASSI mitigate the computational penalty for maintaining many coherency modes, thus allowing consideration of many modes, even for large and complex structures.
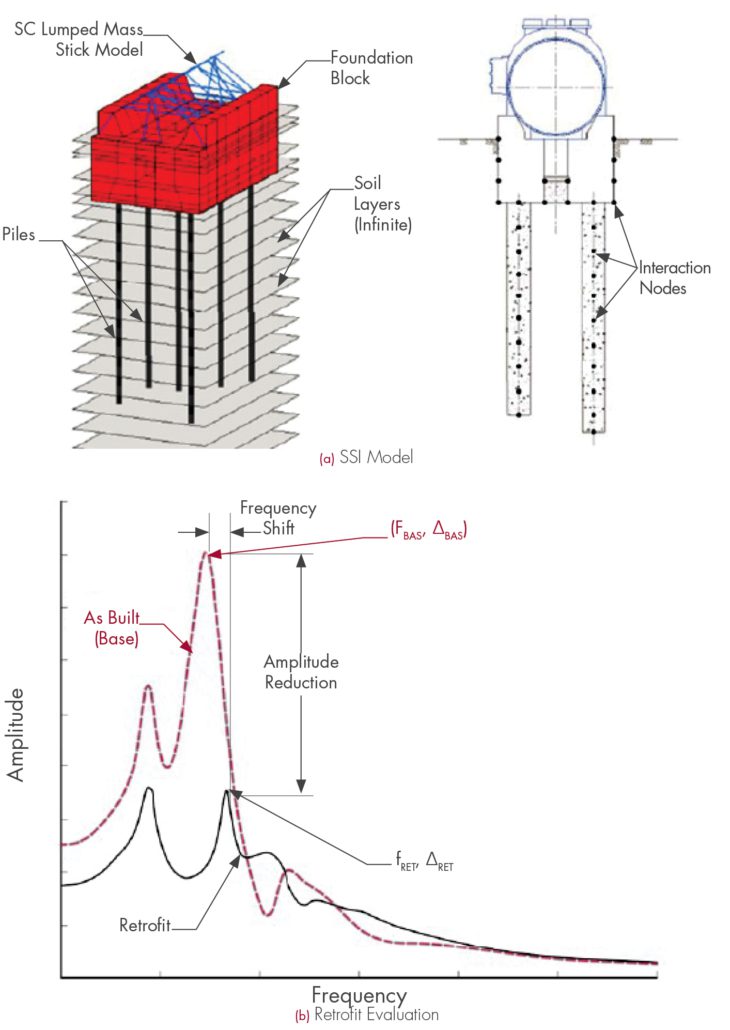
Figure 4. Synchronous Condenser on Pile Foundations and Retrofit Evaluation.
Industrial Facilities on Pile Foundations Pile foundations are frequently used in industrial facilities. While their static analysis and design are widely understood and applied in practice, the contribution to the dynamic response of piles is often neglected, leading to a mischaracterization of the response, like in the case portrayed below.
At the subject hydroelectric generation facility, the synchronous condenser, responsible for adjusting the electric power before it gets input into the transmission grid, experienced undesirable vibration levels during its initial stages of operation. The source of the high vibration levels is attributed to the resonant dynamic interaction between the condenser, its foundation, and the supporting soil media, which went undetected during the initial design process. The foundation of the condenser consists of a massive reinforced concrete block supported on steel casing piles with reinforced concrete infill.
A detailed three-dimensional finite element SSI model was developed to accurately represent the interaction between forces, structure, soil, and foundation, as displayed in Figure 4a. The model was analyzed using the computer software SC-SASSI, including the recently implemented and validated pile elements. The SSI analysis was able to diagnose the problem, and it also served to evaluate feasible remediation solutions (see Figure 4b). The selection of the retrofit solution was performed with the objectives of (1) reducing vibration amplitudes, (2) shifting the system frequency away from the operation frequency, both (1) and (2) being achieved by increasing the system stiffness and therefore minimizing potential resonance conditions, and (3) minimizing the disruption of the surrounding critical equipment already installed.
Conclusions Since SASSI’s development and widespread adoption, enhanced solution algorithms have become available. SC-SASSI has incorporated these into the trusted SASSI framework to efficiently take advantage of modern high-performance computing (HPC). Leveraging SC-SASSI to fully utilize HPC can lead to dramatic project gains with reduced schedules, improved realism, and often more targeted, less conservative solutions.
Expanded SASSI capabilities via HPC functionality allow two primary advantages that lead to project gains: (1) large increases in permissible model sizes and (2) drastically reduced analysis run-time.These two primary advantages allow direct and rigorous treatment of SSI phenomena that previously required gross simplification, compromise, sensitivity studies, and/or overly conservative assumptions.More specifically, SASSI with HPC allows project improvements in areas such as (a) deep embedment with soft soil and high-frequency hazard, (b) structure-soil-structure interaction, (c) combined high-fidelity models for coupled stress analysis and seismic analysis, (d) probabilistic SSI analysis, (e) multiple configurations and/or alternate boundary conditions, (f) multiple hazard levels, (g) pile foundations, and (h) ground motion incoherency effects.
Project examples illustrated in this article demonstrate that the HPC capabilities in SC-SASSI allow treatment of complex SSI phenomena more rigorously and realistically than traditional SASSI approaches, while at the same time offering faster and more efficient analyses. When implemented to their maximum potential, HPC enhancements in SC-SASSI can lead to project gains by reducing cost, schedule, and risk.
References
Lysmer, J., Tabatabaie, M., Tajirian, F.,Vahdani, S., and Ostadan, F.“SASSI – A system for analysis of soil-structure interaction”. Technical Report UCB/GT/81-02, Geotechnical Engineering, University of California, Berkeley, 1981.
SC Solutions, Inc. “SC-SASSI Manual, Version 2.3.2”. Sunnyvale, California, 2018.
Kosbab, B., Garcia, J., Li, W.,Tran, H., Talebinejad, I., Bassam, A., and Tilow, K. “Soil-Structure Interaction: Project Gains through use of High-Performance Computing”. Transactions, SMiRT-24, Busan, Korea, 2017.
https://www.structint.com/wp-content/uploads/2024/07/News-Views-Volume-54-Benefits-of-High-Performance-Computing-for-the-Seismic-Analysis-of-Critical-Facilities-copy.jpg363668Structural Integrityhttps://www.structint.com/wp-content/uploads/2023/05/logo-name-4-930x191-1.pngStructural Integrity2024-07-10 16:14:352024-07-10 16:14:35News and Views, Volume 54 | Benefits of High-Performance Computing for the Seismic Analysis of Critical Facilities
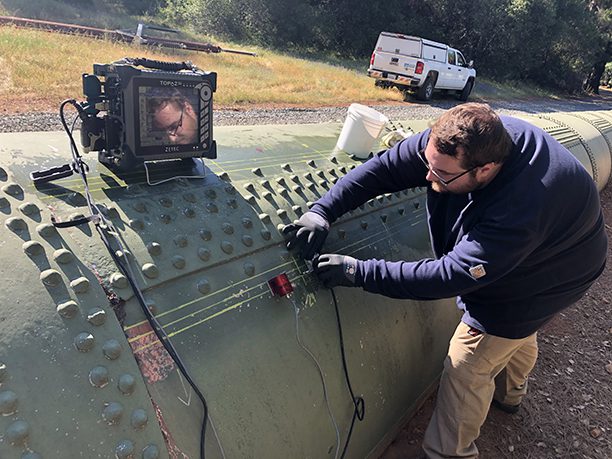
At SI, we regularly combine advanced NDE inspections with fitness for service evaluations to provide value-added solutions for our clients.
Hydroelectric power plants harness two of the most powerful forces on earth, water and gravity.The integrity of the penstocks that flow water to and away from the turbines in these plants is paramount to safe operation and the safety of the surrounding population. With many hydro plants approaching 100 years of service, critical issues can arise with these penstocks, which may have little to no fabrication documentation, may have significant fabrication imperfections, and may have significant accumulated damage from the environment and many years of service.
Our talented, highly experienced NDE staff can complete in-depth hydroelectric penstock inspections for our clients, providing peace of mind that their assets are safe to continue operating long into the future.
Example of Inspections Completed By SI
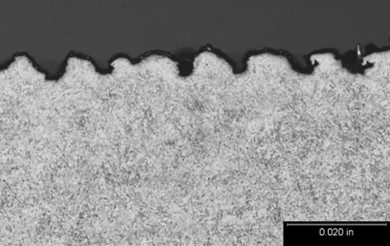
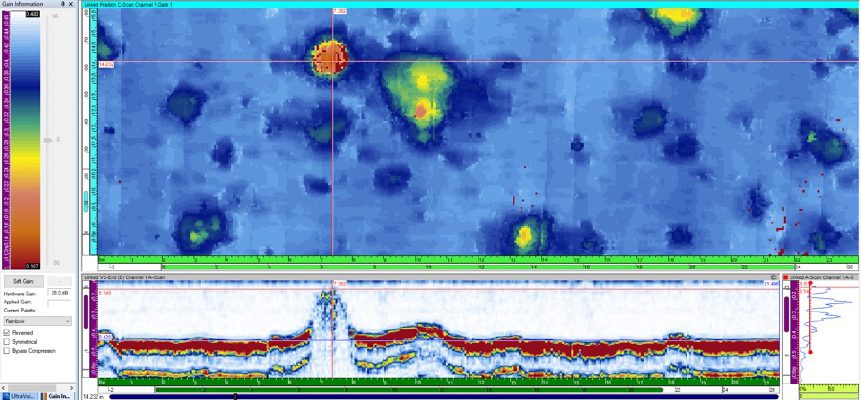
Figure 1. (Top) C-Scan image of corrosion spots on the ID of a penstock with the color scheme relative to material thickness; (Bottom) B-Scan image showing the thinnest thickness reading, 0.140 inch.
Phased Array Ultrasonic (PAUT) Corrosion Mapping of Penstocks
SI works with hydroelectric utility companies to provide detailed thickness measurements on specific areas of penstocks. Phased array ultrasonic corrosion mapping provides hundreds of thousands of thickness readings that can produce a detailed image of the inside surface of a penstock, which may have experienced corrosion or erosion that limits penstock life. This highly detailed scan produces the data required for accurate Fitness for Service (FFS) calculations. PAUT corrosion mapping can be performed from the outside diameter of penstocks that are above ground to detect internal wall thinning, or it can be performed from the inside of a penstock, as long as safe access and confined space requirements are met.An example of the phased array ultrasonic data can be seen in Figure 1 Thickness measurement values, often taken every 0.04 inch (1 mm) along the scan area can be saved and exported using industry standard formats (e.g., CSV, excel, etc.) to support further statistical analysis of the ultrasonic data.
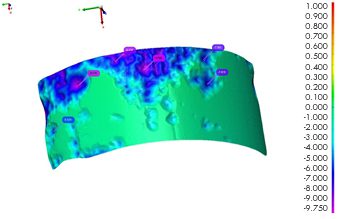
Corrosion Surface Profilometry
Figure 2. Laser scan image of corrosion on the OD of a penstock with pit depths identified.
For a pitted or corroded surface that is accessible to an inspector (ID or OD), the use of a laser profilometry device can be a valuable tool to map and depth size corrosion.Conventional pit gauge measurement of corrosion on penstock surfaces can be a time consuming and inaccurate process.The results rely heavily on the experience of the technician as well as the surrounding surface condition.A more efficient and accurate method is to create an exact image of the surface using a handheld laser scanner.The laser scanning process is very fast and the results can be displayed as a 3D surface or unrolled to a 2D view.Reconstruction of the surface is real-time, with color coding used to provide a visual relevance for material loss.Off-line analysis can be used to make discrete readings of wall loss, or the full map data file can be exported using standard file formats to allow other subsequent analysis to be conducted.
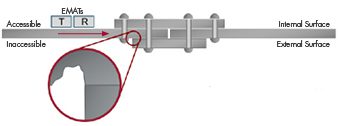
Short Range Guided Wave Technique to Inspect Riveted Joints for Crevice Corrosion
Figure 3. Drawing of potential location for crevice corrosion on a riveted lap-joint.
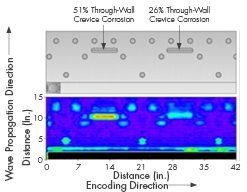
Figure 4. Mock-up drawing and actual examination data from SR-GWT test.
Some penstocks with riveted joints may suffer from crevice corrosion due to the construction geometry of the riveted lap joints.The lap-joint area is generally covered in concrete and buried so the external surface is not easily accessible. The concrete can disbond over time and water collects and runs along the crevice of the plate and butt strap, causing corrosion. The area of crevice corrosion may not be assessed from the internal surface with traditional ultrasonic methods due to the obstruction from the internal butt strap, therefore SI has developed a short range guided wave testing (SR-GWT) technique to inspect for this crevice corrosion. Figure 3 shows an image to help visualize the issue.For this technique electromagnetic acoustic transducers (EMAT) are utilized to propagate sound waves along the volume of the penstock plate to detect a change in the cross-sectional area.Figure 4 shows an example of inspection data that was collected on a calibration plate to prove this technique.
Lap-Welded Longitudinal Seam Inspection
Our staff can complete lap-welded seam identification and inspections. Lap-welded or forge-weld longitudinal seam pipes and penstocks were manufactured in the 1920s (Figure 5). Oftentimes, little to no fabrication documentation exists that will tell a hydroelectric utility if their penstock cans were made with lap-welded seams. SI developed a phased array ultrasonic examination technique to identify areas of lap-welded seams and look for lack of fusion and service damage.
SI developed two different PAUT techniques to identify and examine lap-welded penstocks. A refracted shear wave technique is preferred for ID-connected indications, while a longitudinal wave technique produces sound that is more perpendicular to the weld bond line of the lap-welded joint.Figure 6 shows PAUT scan data along with an explanation of typical features from three different lap-welded seam examinations.
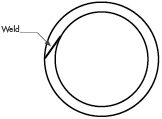
ID/OD Girth Weld Inspection
Figure 5. Illustrated cross-section of a lap weld.
Phased array ultrasonic examination of girth welds is also a common inspection for hydro penstocks. SI’s vast experience inspecting high energy piping systems and pressure vessels translate perfectly to penstock girth weld applications. SI uses ultrasonic software simulation programs to create scan plans that calculate the necessary beam angles and focusing to ensure 100% weld coverage during a PAUT examination. Encoding PAUT data with an automated, semi-automated, or manual encoding device allows for off-line analysis and a permanent record of inspection data. SI also has the ability to create custom scanners, probes, and wedges, when required for difficult inspection applications.The advanced NDE equipment and experience of SI is unmatched.
Figure 6. PAUT scans at 0° incidence (image is analogous to a cross-section of the weld) from hammer-welded pipe showing seam indications (labelled “1”) increased wall thickness at the seam (labelled “2”), and relatively clean areas adjacent to the seam (labelled “3”). The top image and center images show indications from the bond line (likely indicating lack-of-fusion), while the bottom image shows no indications from the bond line. Note that the base material on the left and right ends of the image shows dense areas of small indications, likely attributable to numerous impurities and inclusions in low-quality skelp from which this pipe was manufactured.
SI Can Help
The situations discussed previously demonstrate solutions that SI has developed for hydroelectric penstocks. With our extensive expertise, SI can work with our clients to develop and execute inspection solutions that are customized to their specific needs and provide various engineering analyses based on the examination results.
The next issue of Structural Integrity’s bi-annual technical magazine, News and Views, is now available. In this issue, experts from our Nuclear, Energy Services, Nondestructive Examination (NDE), Pipeline Integrity Compliance Solutions, and Metallurgical Laboratory groups share project case studies and details on technical advancements across a range of industries and disciplines.
CHARLOTTE, NC – SI Solutions is pleased to announce the purchase of SC Solutions, Inc., a respected provider of innovative engineering solutions for the advanced process controls and structural engineering industries. Founded in 1987, SC Solutions has served its clients in Silicon Valley and beyond, expanding to Sacramento, CA, Portland, OR, and Atlanta, GA.
SI Solutions, a privately held company, is a leading provider of mission-critical engineering, construction, testing, and maintenance services to the energy, process, and infrastructure markets. SI Solutions has over 500 employees and ten offices serving customers across the U.S. and internationally. SI’s capabilities span multiple technical disciplines, with a focus on specialized engineering, instrumentation, electrical design and construction, and advanced nondestructive examination.
SC Solutions, Inc. (SC), based in Sunnyvale, CA, specializes in structural engineering and advanced process controls. SC’s structural division has over 35 years of experience with numerical analysis of complex infrastructure assets, including those subjected to extreme loads and events such as earthquakes, dynamic impact, thermal shock, construction transients, and soil-structure-fluid interaction effects. SC’s controls engineering team has extensive experience in control design, modeling of physical systems, real-time software, signal processing, optimization, system identification, and fault diagnostics for the semiconductor, advanced materials manufacturing, energy, infrastructure, and defense industries.
Mark W. Marano, President and CEO of SI Solutions, stated: “Adding SC Solutions to our existing platform will bolster our Critical Infrastructure division, enhancing our ability to serve clients’ needs through new technical capabilities and expanded engineering offerings. SC Solutions’ highly respected process controls division will add a new market segment and a third reputable brand under the SI Solutions umbrella, diversifying our service offerings worldwide.”
Greg Loy, Chairman and co-founder of SC Solutions noted, “I’m proud of our team for the business we’ve built over the years; this is the next step in the company’s evolution. The additional investment from new ownership will allow us to further develop the products and services our clients have come to rely upon.”
Chris Martin, Managing Director of Jumana Capital and Chairman of SI Solutions, remarked, “The addition of SC Solutions to our family of brands grows the strength and capabilities of SI Solutions to meet the growing need for asset management, regulatory compliance, maintenance and upgrades within nuclear power, power services, process industries, pipeline integrity, critical structures, and controls engineering sectors in the United States and abroad. We are excited about the future for SI Solutions as we continue to build toward an extraordinary future.”
https://www.structint.com/wp-content/uploads/2024/01/SC-Solutions-News-copy.jpg363668Structural Integrityhttps://www.structint.com/wp-content/uploads/2023/05/logo-name-4-930x191-1.pngStructural Integrity2024-01-04 18:42:312024-01-04 18:42:31SI Solutions Expands Structural Engineering Expertise and Adds Controls Engineering Division with the Acquisition of SC Solutions, Inc.
STRAIN-INDUCED PRECIPITATION HARDENING (SIPH) IN AUSTENITIC STAINLESS BOILER TUBES
By: Wendy Weiss
Structural Integrity’s Metallurgical Laboratory offers comprehensive metallurgical laboratory services to support client material issues.
Strain-Induced Precipitation Hardening, also known as SIPH, is a commonly misinterpreted boiler tube failure mechanism that occurs when austenitic stainless steel tubing is cold or warm worked during fabrication and then is installed with either improper or no solution annealing heat treatment. While the basic mechanism and the root cause are understood, the complex interaction between heat chemistry, quantity of cold or warm work, and subsequent thermal history makes it very difficult to predict under precisely what circumstances damage due to SIPH will result in failure of a boiler tube.
Longitudinally oriented crack at the extrados of a bend in a stainless steel superheater tube.
Mechanism SIPH occurs when a heat of austenitic stainless steel containing certain precipitate-forming elements (e.g., niobium, titanium, vanadium, etc.) either intentionally or as residuals is cold or warm worked during subsequent material processing. The cold or warm working creates excess defects in the sub-structure of the material, which serve as preferred sites for precipitation of temper-resistant carbides or carbo-nitrides. Precipitation occurs when the material is heated to a sufficiently high temperature that is well below the solution annealing temperature. This can occur rapidly during a poorly executed heat treatment if the material does not reach the proper solution annealing temperature, or it can occur more slowly at typical operating temperatures for superheater or reheater tubing in utility-type boilers.
Once formed, precipitates anchor to the defects, resulting in a substantial increase in the elevated temperature or creep strength of the interior of the grains. At the same time, there is a narrow zone of material immediately adjoining the grain boundaries that remains largely precipitate-free due to the diffusional characteristics of the grain boundary itself. Ultimately, the interior portion of the individual grains becomes very strong at elevated temperatures while the material immediately adjoining the grain boundaries becomes comparatively creep weak. In addition, any surface-active elements that may be present in the material, such as arsenic, tin, antimony, etc., will tend to concentrate at the grain boundaries, further reducing their strength.
Regardless of when the precipitation occurs, once the interior of the grains has been strengthened, the grain boundary regions are weakened. Any strain imposed on the material in response to an applied or residual stress is forced to concentrate in the grain boundary region, which substantially magnifies its effect. For example, suppose the bulk strain experienced by a cold-worked stainless superheater tube segment is very small – a fraction of a percent – and the material has undergone the SIPH reaction. The strengthened grain interiors will undergo no strain. Conversely, within the much smaller volume of the comparatively weak grain boundaries, the accumulated strain will be orders of magnitude higher than the bulk level.
Typical Locations
Bends
Offsets
Swages
Welded attachments
Features
Can initiate at midwall
Early-stage damage consists largely of grain boundary cavities and microfissures
Intergranular cracking
Root Causes The single root cause of SIPH is the failure to properly solution anneal susceptible heats of austenitic stainless steel tubing that has been either cold or warm worked during fabrication.
An overall, cross-sectional view of the intergranular crack (image A) with higher magnification views of some of the secondary grain boundary microfissures and voids (image C). Slip bands (parallel lines in image B) indicate local deformation.
For any situation involving material property characterization, Structural Integrity has an experienced group of materials specialists and a full-service metallurgical testing laboratory that can help.
A client recently ordered a Type 316 stainless steel pipe coupling fitting for use in a high-pressure, high-temperature steam line operating at 1005°F.The fitting that was received was so-called dual grade Type 316/316L stainless steel.Given the limitations on using “L” grades of stainless steel at high temperatures, the client requested that SI perform a serviceability assessment for the fitting to determine if it could be safely used until the next scheduled outage when a replacement non-L grade fitting would be available.
BACKGROUND The fitting ordered was a ½” nominal diameter (NPS ½), 6000# (Class 6000) full coupling socket-welding fitting in accordance with the ASME B16.11 specification, material ASME SA-182 forging, Type 316 stainless steel (designated as F316 in SA-182).The fitting supplied was dual grade F316/316L material with a carbon content of 0.023% per the material test certificate.The designation of this material as “dual grade” means that it meets the requirements of both F316 and F316L material grades.This is possible because the chemical composition requirements of these two grades overlap, with the primary difference between them being carbon content.For F316 the carbon content is specified to be 0.08% maximum (no minimum), while for F316L the carbon content is specified to be 0.030% maximum.Therefore, material with carbon content less than 0.030% will meet the requirements for both grades.It is worth noting that the carbon content of “H” grade of 316 stainless steel (F316H per SA-182) is specified to be 0.04-0.10%.The H grade is intended for use at high temperatures.
The received fitting was installed in a main steam valve pressure equalizing line with a steam temperature/pressure of 2750 psia/1015°F at design conditions and 2520 psia/1005°F at operating conditions.The fitting was welded to Grade P11 pipe on one side and Grade P22 pipe on the other side.The applicable code was stated to be ASME BPVC Section I.
With a reported carbon content of less than 0.04%, the fitting is technically not permitted for use in ASME Section I construction above a temperature of 1000°F.Per the ASME Boiler and Pressure Vessel Code (BPVC) Section II, Part D, Table 1A, the allowable stresses for SA-182, F316 material are valid at or above 1000°F only when the carbon content is greater than 0.04% (Note G12).Per the same table, SA-182, F316L material is only permitted for use in Section I construction up to 850°F.The reason for this temperature limitation is that the long-term creep-rupture strength of Type 316 stainless steel with lower carbon content is reduced compared to material with higher carbon content because fewer carbides form during service to strengthen the grain boundaries.There are no other adverse impacts of the lower carbon content, e.g., on fatigue strength or oxidation resistance.
The short-term serviceability of the fitting with low carbon content was assessed by comparing bounding pressure stresses in the fitting with the reported creep-rupture strength for Type 316L material.Per the ASME B16.11 specification, Class 6000 socket-welding fittings are compatible with NPS Schedule 160 pipe, meaning that pressure stresses in the fitting will be less than those in Sch 160 pipe with minimum wall thickness according to ASME B36.10 (pipe dimension specification), in other words, the fitting will be at least as strong as the pipe.
ASSESSMENT The dimensions of NPS ½, Schedule 160 pipe per the ASME B36.10 pipe specification are 0.84” outer diameter (OD), 0.165” minimum wall thickness (MWT).For an operating steam pressure of 2,520 psi, the reference hoop stress per the equation in ASME BPVC Section I, Appendix A-317 is 5.05 ksi.Per the general design guidance in ASME B16.11 (Section 2.1.1) the pressure stresses in the fitting must be less than this.
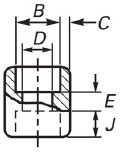
Figure 1. Schematic diagram for a socket-welding coupling fitting. Per ASME B16.11, an NPS ½, Class 6000 fitting has relevant dimensions B = 0.875” maximum, C = 0.204” minimum, and D = 0.434” minimum.
Since the fitting in question is cylindrical, comparative hoop stresses can also be calculated from dimensions given in ASME B16.11, although these may not be exact due to the varied wall thickness in the fitting.According to Table I-1 of ASME B16.11, the central body of the fitting is 1.283” OD and 0.395” MWT (Figure 1).The reference hoop stress calculated using the A-317 equation at 2,520 psi stream pressure and these dimensions is 2.63 ksi, considerably less than 5.05 ksi.In the female socket ends of the fitting, the OD is also 1.283”, but the minimum wall thickness is 0.204”, leading to a calculated reference hoop pressure stress of 6.58 ksi.Note that the actual stresses in the socket ends will be much less than this because the pipe will be inserted and welded into the socket, taking up the pressure loading, but the calculated stress can be taken as a bounding value.
Creep-rupture strengths for Type 316L stainless steel have been reported in ASTM Data Series DS 5S2 publication, “An Evaluation of the Yield, Tensile, Creep, and Rupture Strengths of Wrought 304, 316, 321, and 347 Stainless Steels at Elevated Temperatures” (ASTM, 1969).According to Table 7 in this report, the average 10,000 hour creep-rupture strengths for Type 316L at 1000°F and 1050°F are 34.5 and 25 ksi, respectively.Minimum creep-rupture strengths are typically taken as 80% of the average strength, so the inferred minimum strengths at 1000°F and 1050°F are 27.6 and 20 ksi, respectively.
The reported 10,000 hour creep-rupture strengths in the temperature range of interest are more than twice the calculated bounding pressure stresses in the fitting, so it was judged that there is very little risk of failure of the fitting by creep-rupture in the next 10,000 hours of service.
This result is unsurprising since the 1005°F is barely into the creep range for Type 316 regardless of carbon content.The carbon content effects become more pronounced at higher temperatures (approximately 1100°F and above).
CONCLUSION Based on the above assessment, it was SI’s opinion that the Type 316L fitting with carbon content less than 0.03% was suitable for a limited period of service (less than 10,000 hours) until it can be replaced.Given that the fitting is reportedly welded to low-alloy steel pipe on either side, SI also recommended that a Grade 22 (2.25Cr-1Mo) low-alloy steel fitting be considered as a replacement, which would eliminate dissimilar metal welds (DMWs) between the fitting and pipes.DMWs are prone to premature failure due to thermal fatigue, weld fusion line cracking, and decarburization of the ferritic material. This voluntary recommendation made by SI, was not part of the original scope of work, but may have been just as critical a finding as it shed light upon a failure risk previously unknown by the client.
At Structural Integrity Associates (SIA), we take cybersecurity very seriously for ourselves and our clients, who expect us to protect the sensitive information shared with us with the same rigor as their internal policies.
Recognizing this dedication, we are excited to announce that SI received the Service Organization Control (SOC) 2, Type II certification for our Asset Information Management System (AIMS) platform. In short, this means that all products built on AIMS (see sidebar) fully comply with the latest cybersecurity standards.
SOC 2 is an auditing framework created by the American Institute of Certified Public Accountants (AICPA). It reviews an organization’s processes and procedures regarding client security, confidentiality, privacy, availability, and processing integrity. The comprehensive review includes extensive auditing over a prolonged period. To be certified, there must be detailed planning, constant monitoring, and continual improvements to uphold the challenging requirements of the AICPA. The SOC 2, Type II certification is a significant milestone that demonstrates to our clients that we operate in a secure environment.
AIMS is an industry-agnostic asset management platform used to build applications that store, visualize, and analyze information for industrial assets. It is a low-code application platform that can be configured to manage any industrial asset. Its flexible structure, easy integration with time series data, and advanced analytics make it ideal for managing critical assets and building Digital Twins for industrial resources.
“The AIMS Digital Solutions platform is integral to Structural Integrity’s mission to be the most trusted provider of best-in-value, innovative, fully integrated asset lifecycle solutions. Digital products paired with our expertise in Engineering, Inspections, and Analytics help us provide holistic asset management solutions to our clients. Receipt of the SOC 2, Type II certification assures users of the integrity of the software of the AIMS applications.”
Anup Aggarwal – Director of Digital Transformation
Structural Integrity is proud to continue supporting our clients by providing these applications for critical asset management and ensuring their cyber security.
We may request cookies to be set on your device. We use cookies to let us know when you visit our websites, how you interact with us, to enrich your user experience, and to customize your relationship with our website.
Click on the different category headings to find out more. You can also change some of your preferences. Note that blocking some types of cookies may impact your experience on our websites and the services we are able to offer.
Essential Website Cookies
These cookies are strictly necessary to provide you with services available through our website and to use some of its features.
Because these cookies are strictly necessary to deliver the website, refusing them will have impact how our site functions. You always can block or delete cookies by changing your browser settings and force blocking all cookies on this website. But this will always prompt you to accept/refuse cookies when revisiting our site.
We fully respect if you want to refuse cookies but to avoid asking you again and again kindly allow us to store a cookie for that. You are free to opt out any time or opt in for other cookies to get a better experience. If you refuse cookies we will remove all set cookies in our domain.
We provide you with a list of stored cookies on your computer in our domain so you can check what we stored. Due to security reasons we are not able to show or modify cookies from other domains. You can check these in your browser security settings.
Google Analytics Cookies
These cookies collect information that is used either in aggregate form to help us understand how our website is being used or how effective our marketing campaigns are, or to help us customize our website and application for you in order to enhance your experience.
If you do not want that we track your visit to our site you can disable tracking in your browser here:
Other external services
We also use different external services like Google Webfonts, Google Maps, and external Video providers. Since these providers may collect personal data like your IP address we allow you to block them here. Please be aware that this might heavily reduce the functionality and appearance of our site. Changes will take effect once you reload the page.
Google Webfont Settings:
Google Map Settings:
Google reCaptcha Settings:
Vimeo and Youtube video embeds:
Other cookies
The following cookies are also needed - You can choose if you want to allow them:
Privacy Policy
You can read about our cookies and privacy settings in detail on our Privacy Policy Page.


 BACKGROUND