At Structural Integrity Associates (SIA), we take cybersecurity very seriously for ourselves and our clients, who expect us to protect the sensitive information shared with us with the same rigor as their internal policies.
Recognizing this dedication, we are excited to announce that SI received the Service Organization Control (SOC) 2, Type II certification for our Asset Information Management System (AIMS) platform. In short, this means that all products built on AIMS (see sidebar) fully comply with the latest cybersecurity standards.
SOC 2 is an auditing framework created by the American Institute of Certified Public Accountants (AICPA). It reviews an organization’s processes and procedures regarding client security, confidentiality, privacy, availability, and processing integrity. The comprehensive review includes extensive auditing over a prolonged period. To be certified, there must be detailed planning, constant monitoring, and continual improvements to uphold the challenging requirements of the AICPA. The SOC 2, Type II certification is a significant milestone that demonstrates to our clients that we operate in a secure environment.
AIMS is an industry-agnostic asset management platform used to build applications that store, visualize, and analyze information for industrial assets. It is a low-code application platform that can be configured to manage any industrial asset. Its flexible structure, easy integration with time series data, and advanced analytics make it ideal for managing critical assets and building Digital Twins for industrial resources.
“The AIMS Digital Solutions platform is integral to Structural Integrity’s mission to be the most trusted provider of best-in-value, innovative, fully integrated asset lifecycle solutions. Digital products paired with our expertise in Engineering, Inspections, and Analytics help us provide holistic asset management solutions to our clients. Receipt of the SOC 2, Type II certification assures users of the integrity of the software of the AIMS applications.”
Anup Aggarwal – Director of Digital Transformation
Structural Integrity is proud to continue supporting our clients by providing these applications for critical asset management and ensuring their cyber security.
Structural Integrity Associates, Inc. (SIA) is pleased to announce the addition of Daniel (Dan) Patten as Director, Strategic Business Development. Mr. Patten comes to SIA with a diverse background in the power generation industry. Most recently, Mr. Patten served as the Fleet Engineering Manager for Energy Harbor, where he held responsibility for Fleet Programs Engineering (Buried Pipe, Flow Accelerated Corrosion, Inservice Inspection, Non-Destructive Examination, etc.), Probabilistic Risk Assessment, Life Cycle Management (for critical components), Procurement, and more. Mr. Patten has also held multiple leadership roles at PSEG, supporting critical nuclear and fossil fleet initiatives. Mr. Patten’s expertise extended into serving on multiple EPRI committees, including acting as Subgroup Chairman from 1997 through 2023 and, most recently, with the Welding and Repair Technology Committee (WRTC).
Regarding the arrival of Mr. Patten to Structural Integrity Associates, Mike Battaglia, SIA’s Vice President, Nuclear and Chief Nuclear Officer, stated, “Dan’s breadth of experience and demonstrated leadership in the nuclear industry is widely recognized. In addition, he will bring the perspective of the nuclear utility clients to better position our products and services. We are excited and fortunate to welcome Dan into the fold at Structural Integrity Associates.”
Mr. Patten has a Master of Science degree in Materials Engineering and a Master of Science in Engineering Management.
https://www.structint.com/wp-content/uploads/2023/10/NEWSw-Logo-Dan-Patten-copy.jpg363668Structural Integrityhttps://www.structint.com/wp-content/uploads/2023/05/logo-name-4-930x191-1.pngStructural Integrity2023-10-06 13:20:452023-10-06 13:20:45Dan Patten Appointed Director, Strategic Business Development
IN PRESSURIZED WATER REACTOR (PWR) COOLANT SYSTEMS
By: John Hayden and Jason Van Velsor
The CASS piping welds present in many PWR plants provide numerous and complicated challenges to their effective ultrasonic examinations. To this point, a viable ultrasonic examination solution for the inspection of these piping components, as required by ASME Code Section IX,had previously not been available. By leveraging our technical expertise in materials, technology development, and advanced NDE deployment, Structural Integrity Associates, Inc (SI) has developed a new system that will provide a meaningful solution for the examination of CASS piping components. The result of this program will be the first commercial offering for the volumetric examination of CASS components in the nuclear industry.
BACKGROUND INFORMATION ASME Section XI Class 1 RCS piping system welds fabricated using CASS materials pose serious and well-understood challenges to their effective ultrasonic examination. For decades, utilities and regulators have struggled with the administrative and financial burdens of Relief Requests, which were, and still are, based on the inability to perform meaningful volumetric examinations of welds in CASS components.
Many years of futility and frustration may have fostered the belief that technology allowing effective and meaningful examination of CASS materials would never be achievable. This is no longer the case.
The failure mechanism for CASS material occurs through the loss of fracture toughness due to thermal aging embrittlement. The susceptibility of CASS material to thermal aging embrittlement is strongly affected by several factors, primary of which are system operating time and temperature, the casting method used during component manufacture, and molybdenum and ferrite content. In addition to the existing ASME Section XI requirements for the examination of welds in CASS materials, the susceptibility to thermal aging embrittlement drives the requirement for additional examinations (including ultrasonic examinations) as directed by several NRC-published NUREGs required for plant license renewal. The existence of a viable, effective examination capability for CASS materials plays a very important part in both currently required Inservice Inspections (ISI) and plant license renewal.
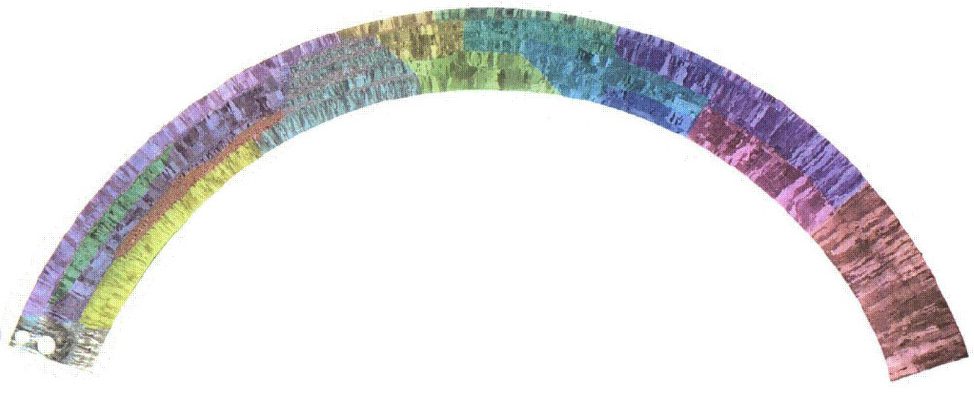
Figure 1. An example of the widely-varying microstructure of a centrifugally cast piping segment. False-color imaging is used to aid visualizing grain variations. (Image from NUREG/CR-6933 PNNL-16292)
CASS MATERIAL PROPERTIES AND EFFECT ON ULTRASONIC EXAMINATION Metallurgical studies have revealed that the microstructure of CASS piping can vary drastically in the radial (through-wall) direction, as well as around the circumference and along the length of any given piping segment. Large and small equiaxed, columnar and mixed (combinations of equiaxed and columnar grains), and banding (layers of substantially different grain structures) are commonly observed in CASS piping materials. None of these conditions favor the performance of effective ultrasonic examinations.
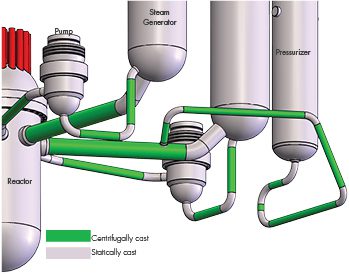
Figure 2. PWR RCS Major Components
The very large and widely varying types (equiaxed, columnar, and randomly mixed), sizes and orientations of the anisotropic grains in CASS material are very problematic. Anisotropic is defined as an object or substance having a physical property that has a different value when measured in different directions. Such physical properties strongly affect the propagation of ultrasound in CASS material by causing severe attenuation (loss of energy through beam scattering and absorption), beam redirection, and unpredictable changes in ultrasonic wave velocity. These factors are responsible for the inability of ultrasonic examination to completely and reliably interrogate the Code-required volume (inner 1/3 Tnom) of welds in CASS piping material. Interestingly, CASS materials less than 1.6” Tnom (Pressurizer Surge Piping) can be effectively examined, while CASS materials over 2.00” (Main RCS Coolant Loop Piping) are less effectively examined.Consequently, an ASME Section XI, Appendix VIII qualification program for CASS piping components has not been established and remains in the course of preparation. Nonetheless, ASME Section XI requirements to conduct inservice examinations of RCS piping welds fabricated from CASS components remain fully in force.
ASME CODE ACTIONS AFFECTING CASS PIPING EXAMINATIONS ASME Section XI Code Case N-824, “Ultrasonic Examination of Cast Austenitic Piping Welds From the Outside Surface,” was approved by ASME in October 2012 and by the NRC in October 2019. This Code Case provides the first approved direction for the ultrasonic examination of welds joining CASS piping components. The ASME B&PV Code, Section XI, 2015 Edition, incorporates Code Case N 824 into Mandatory Appendix III in the form of Mandatory Supplement 2. To date, these two ASME Section XI Code documents remain the sole sources approved by ASME and NRC that provide specific direction for the examination of CASS RCS piping system welds and, therefore, form the foundation of SI’s approach for the development of our CASS ultrasonic examination solution.
SI’S CASS PROGRAM DESCRIPTION SI is developing the industry’s most well-conceived and capable ultrasonic system for the examination of welds in CASS piping components. To accomplish this objective, SI has drawn upon our internal knowledge and experience, supplemented by a careful study of numerous authoritative bodies of knowledge relating to the examination of CASS components. The development of the SI examination system has been guided by both SI’s industry-leading 17 years of experience conducting phased array examinations in nuclear power plants and the knowledge acquired through the careful study of the topical information contained within industry-recognized publications. These published results of extensive industry research provided both guidance for the selection of phased array system components and CASS-specific material insights that strengthen the technical content of our Appendix III-based procedure.
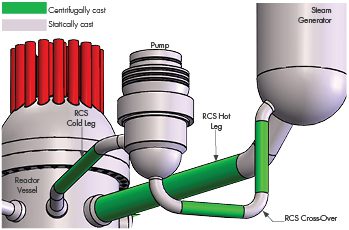
Figure 3. RCS Coolant Pump and Crossover Piping
CASS PROGRAM ELEMENTS SI believes that the procedure, equipment and personnel featured in this program will be equivalent or superior to those that will form the industry-consensus approach for CASS ultrasonic examinations needed to successfully achieve Appendix VIII, (future) Supplement 9, “Qualification Requirements for Cast Austenitic Piping Welds.”
Ultrasonic Procedure – SI has crafted an ultrasonic examination procedure framework that is fully compliant with ASME Section XI, Mandatory Appendix III, Supplement 2, along with referenced Section XI Appendices as modified by the applicable regulatory documents.
Ultrasonic Equipment – SI has acquired and assembled the ultrasonic system components required by Code Case N-824 and Appendix III, Supplement 2, which includes the following:
Ultrasonic instrumentation capable of functioning over the entire expected range of examination frequencies. The standard examination frequency range extends from low-frequency, 500 KHz operation for RCS main loop piping welds through 1.0 MHz for pressurizer surge piping.
SI has designed and acquired additional phased array transducers that meet the physical requirements of frequency, wave mode, and aperture size and are capable of generating the prescribed examination angles with the required focal properties. SI has designed and fabricated an assortment of wedge assemblies that will be mated with our phased array probes to provide effective sound field coupling to the CASS components being examined. SI’s wedge designs consider the CASS pipe outside diameter and thickness dimensions and employ natural wedge-to-material refraction to assure optimal energy transmission and sound field focusing.
SI also possesses several data encoding options that are necessary to acquire ultrasonic data over the expected range of component access and surface conditions. The encoding options will include:
Fully-automated scanning system, capable of driving the relatively large and heavy 500KHz phased array probes
The SI-developed Latitude manually-driven encoding system, which has been deployed during PDI-qualified dissimilar metal DM weld examinations in nuclear power plants
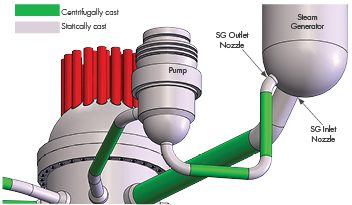
Figure 4. Steam Generator Details
Examination Personnel – SI’s ultrasonic examination personnel are thoroughly trained and experienced in all elements of encoded ultrasonic data acquisition and analysis in nuclear plants. SI’s examiners have a minimum of 10 years of experience and hold multiple PDI qualifications in manual and encoded techniques. SI recognizes the challenges that exist with the examination of CASS piping welds and has developed a comprehensive program of specialized, mandatory training for personnel involved with CASS examinations. This training includes descriptions of coarse grain structures, their effect on the ultrasonic beam, and the expected ultrasonic response characteristics of metallurgical and flaw reflectors, as well as the evaluation of CASS component surface conditions.
ULTRASONIC TECHNQUE VALIDATION Although not required by the ASME Code, SI has arranged for access to CASS piping system specimens from reputable sources to validate the efficiency of our data acquisition process and the performance of our ultrasonic examination techniques. The specimens represent various pipe sizes and wall thicknesses and contain flaws of known location and size to permit the validation and optimization of SI’s data acquisition and analysis processes. SI will thoroughly analyze, document, and publish the results of our system performance during the examination of the subject CASS specimens.
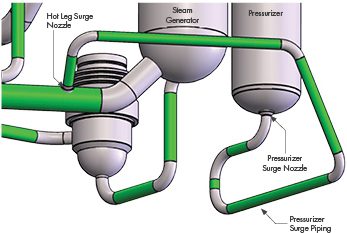
Figure 5. Pressurizer and Surge Line Details
CASS PIPING SYSTEM APPLICATIONS Typical CASS Piping Weld Locations in PWR Reactor Coolant Systems The following graphic illustrates the location and extent of CASS materials in the RCS of many PWR plants.
RCS Main Loop Piping Welds: This portion of the RCS contains large diameter butt welds that join centrifugally cast stainless steel (CCSS) piping segments to statically cast stainless steel (SCSS) elbows and reactor coolant pump (RCP) casings. RCS main loop piping includes the following subassemblies:
Hot leg piping from the Reactor Vessel Outlet to the SG Inlet
Cross-over piping from the SG Outlet to the RCP Inlet
Cold leg piping from the RCP Outlet to the RPV Inlet
Steam Generator Inlet / Outlet Nozzle DM Welds: These terminal end DM butt welds are present in PWR plants, both with and without safe ends between the SCSS elbows and the ferritic steel nozzle forgings.
Pressurizer Surge Piping Welds: This portion of the RCS contains a series of butt welds fabricated using CCSS piping segments to SCSS elbows between the Pressurizer Surge nozzle end and the Hot Leg Surge nozzle.
SUMMARY The CASS piping welds present in many PWR plants provide numerous and complicated challenges to their effective ultrasonic examinations. SI’s new CASS ultrasonic examination system will provide a new and meaningful solution.
PROJECT TIMELINE SI is working to complete the development, integration and capability demonstrations of the CASS ultrasonic examination system described in this document for limited (emergent) fall 2023 and scheduled deployments beginning in spring 2024.
Traditional nondestructive examination (NDE) activities are planned based on hours of service, number of load cycles, time elapsed since previous inspections, or after the emergence of clear and obvious damage in a component. While engineering judgment and risk analysis can, and should, be used to prioritize inspections, these prioritizations are not based on the actual physical condition of the component or material it is constructed from but on precursory conditions that may or may not lead to eventual damage. Alternatively, continuous monitoring approaches can facilitate advanced planning and the optimization of Operations and Maintenance (O&M) spending by enabling the prioritization of inspections based on a component’s actual current condition. Furthermore, continuous monitoring enables earlier detection, which allows the extension of the component’s remaining useful life through modified operation.
SI’s recent advances with thick-film are breakthrough technologies for long-term monitoring and imaging of crack growth in critical components.
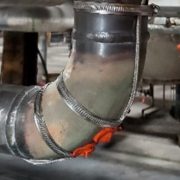
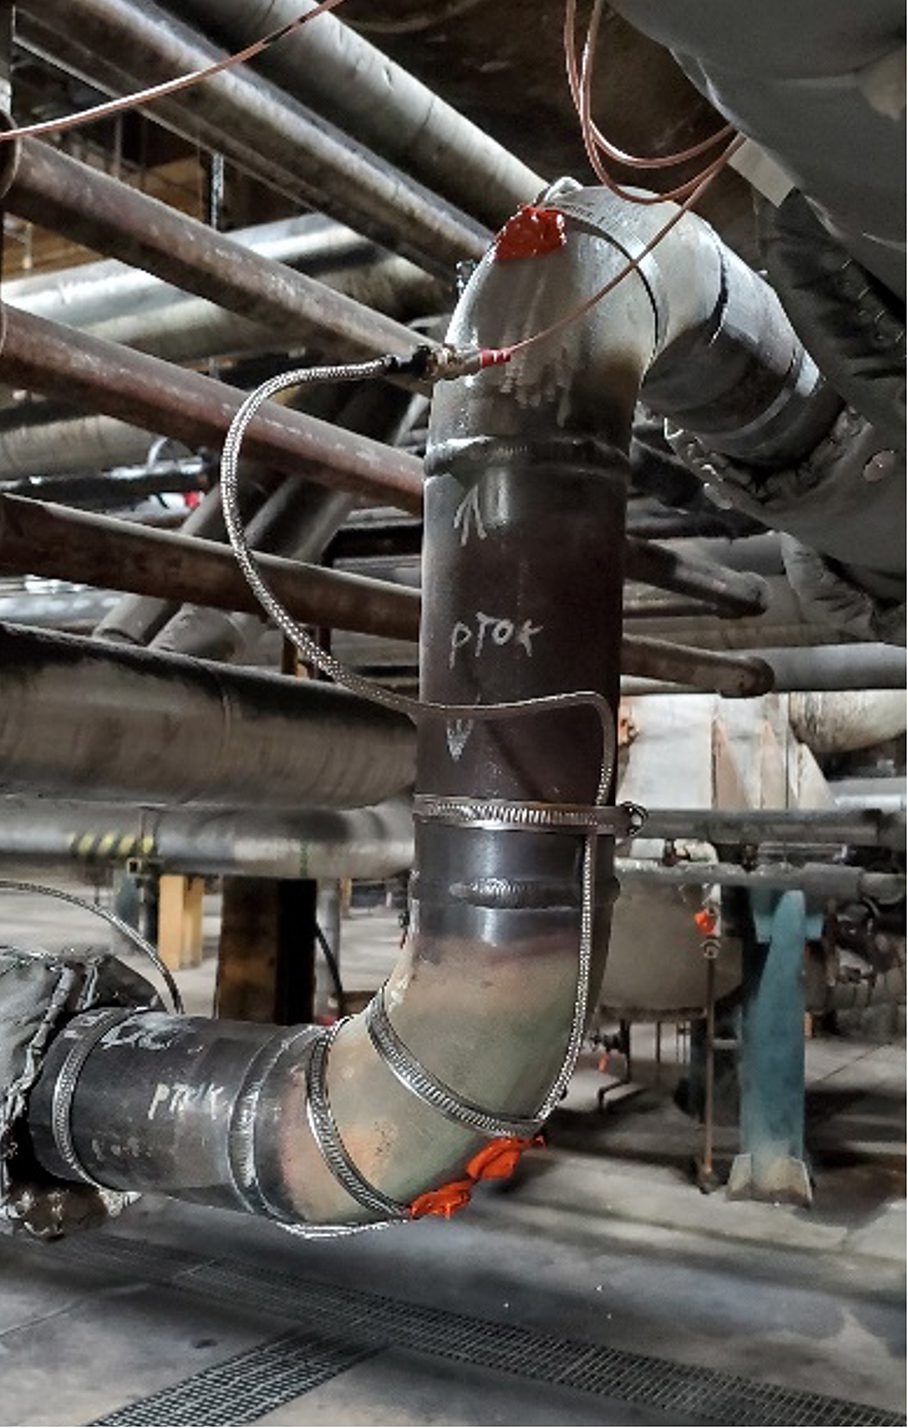
Figure 1. Installed thick-film UT sensors for thickness monitoring of elbows.
Given the trend of fewer on-site resources and tighter O&M budgets, the energy industry has a strong motivation to progress toward condition-based inspection and maintenance. To facilitate this evolution in asset management strategy, new monitoring sensor technologies are needed, ones that provide meaningful monitoring data directly correlated to the condition of the material or asset. To support this need Structural Integrity has developed a novel thick-film ultrasonic sensor solution. Initially developed for basic applications, such as thickness monitoring, SI’s recent advances with this technology make long-term monitoring and imaging of crack growth in critical components possible.
BACKGROUND Ultrasonic thick-films are comprised of a piezoelectric ceramic coating that is deposited on the surface of the component that will be monitored. A conductive layer is then placed over the ceramic layer, and the ceramic layer deforms when an electric potential is applied across the film. When a sinusoidal excitation pulse in the ultrasonic frequency range is applied across the film, the vibration of the film is transferred into the test component as an ultrasonic stress wave.
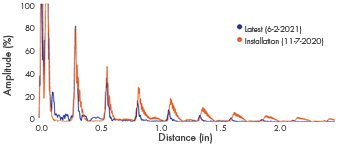
Structural Integrity initially developed our thick-film ultrasonic sensors for real-time thickness monitoring and has demonstrated the performance and longevity of this technology through laboratory testing and installation in industrial power plant environments, as seen in the photograph in Figure 1, where the sensors have been installed on multiple high-temperature piping components that are susceptible to wall thinning from erosion. In this application, the sensors are fabricated directly on the pipe’s external surface, covered with a protective coating, and then covered with the original piping insulation. Following installation, data can either be collected and transferred automatically using an installed data acquisition instrument, or a connection panel can be installed that permits users to acquire data periodically using a traditional off-the-shelf ultrasonic instrument. Example ultrasonic datasets are shown in Figure 2.
Figure 2. Ultrasonic datasets from an installed thick-film UT sensor at two different points in time.
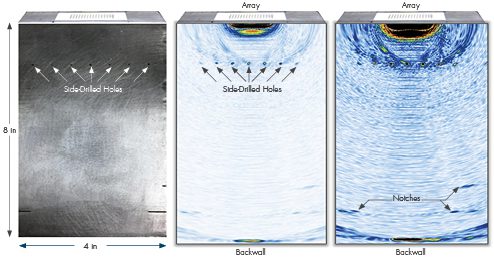
TECHNOLOGY ADVANCEMENTS Recently, SI has demonstrated the ability to create thick-film sensors with complex element arrays that can be individually controlled to steer and focus the sound field, as with traditional phased-array ultrasonic testing (PAUT). Moreover, data from individual array elements can be acquired and post-processed using full-matrix capture (FMC) techniques. FMC is a data acquisition technique where all elements in the array are used to both transmit and receive ultrasonic waves. The result is a large data matrix that can be used for further processing with various post-processing techniques. Compared to more traditional active focusing, FMC is well-suited for a fixed transducer array, as scanning speed is not a concern. Another advantage is that the electronics needed for data acquisition can be simplified – requiring only a single pulsing channel.
A thick-film Linear-Phased Array (LPA) installed on a standard calibration block is shown in Figure 3. The two images shown on the right were generated using the Total Focusing Method (TFM) post-processing algorithm, with the image on the far right having an adjusted color scale to highlight the imaging of the notches toward the bottom of the calibration block. TFM is an amplitude-based image reconstruction algorithm where the A-scans from the FMC dataset are used to synthetically focus on every point in a defined region of interest.
Figure 3. FMC TFM results from a thick-film linear phased array installed on a calibration block.
Using other information from the FMC dataset, such as the phase of the waveforms, has proven to be beneficial in certain cases. At each focal point in the region of interest, a large phase coherence among all the waveforms can be indicative of a focused reflector. This can then be applied to the TFM image at each focal point as a weighting factor (also known as the Phase Coherence Factor (PCF)) to improve the signal-to-noise ratio.
Figures 4 and 5 illustrate the results of applying the phase coherence imaging technique to the FMC datasets collected with thick film transducer arrays. The sample is a section of high-energy piping approximately 1.7 inches thick with cracking at various positions along a girth weld. The sample has a counterbore with ID-initiated cracks up to approximately 0.5 inches in length coming from the taper of the counterbore. The thick film transducer arrays were located at different positions along the weld.
SUMMARY The energy industry is moving away from traditional scheduled-based planning for inspection and maintenance activities and toward “smart plant” concepts that rely more heavily on data correlated to actual component conditions. To accomplish this, there is a need for new and novel monitoring technologies that are both unobtrusive and able to withstand the harsh conditions of industrial facilities. Collecting robust and meaningful monitoring data will be critical in ensuring that safety and asset reliability are maintained and even improved. Structural Integrity’s thick-film UT technology has been developed to achieve this goal and continues to evolve for higher-temperature components and more advanced applications. We are ready to support a variety of in-field applications, contact one of SI’s experts if you have questions or a potential application that could benefit from installed thick-film UT sensors.
Figure 4. Phase coherence imaging result from a thick film transducer array on a cracked weld sample.
Figure 5. Phase coherence imaging result from a thick film transducer array on a cracked weld sample.
By: Scott Riccardella, Owen Malinowski and Chris Tipple
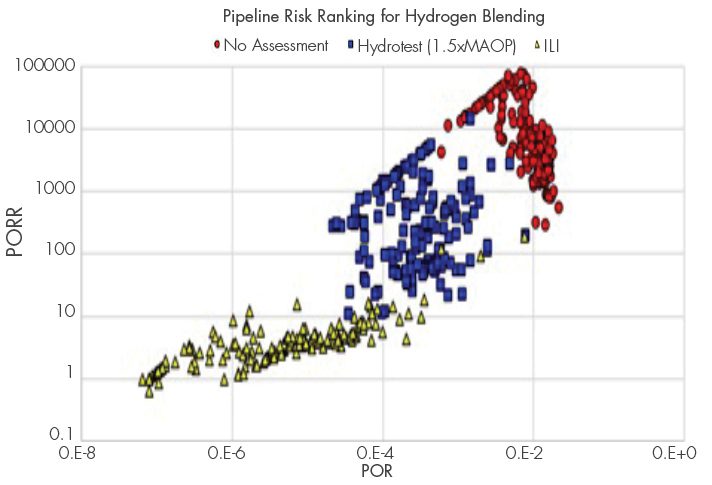
Several pipeline operators have established pilot demonstration programs to blend hydrogen with natural gas (hydrogen blending) in their gas transmission pipelines.Structural Integrity Associates (SI) has been providing clients technical consulting support to complete engineering critical assessment (ECA) projects to help evaluate the potential impact to pipeline integrity and help ensure the safety of the public, customers, employees, and the natural gas pipeline infrastructure.
In a recent study, girth weld defects were identified as a key threat to pipeline integrity, particularly when the pipeline is exposed to large axial strain due to soil movement (which can be experienced from landslides, underwater erosion, storm surge, ground settlement and lateral spreading).The impact to girth weld defects combined with large strain can pose a significant threat that is further exacerbated with hydrogen blending.SI developed and implemented a program to complete a detailed ECA using probabilistic risk modeling to assess the probability of rupture (POR) to an offshore pipeline that had experienced significant strain due to erosion of the channel area, pipeline movement, and sand waves in the sea channel.
To complete the ECA, a probabilistic analysis was performed consisting of the following activities:
REVIEW OF IN-LINE INSPECTION RESULTS
Recent strain data collected from an Inertial Mapping Unit (IMU) In-Line Inspection (ILI) tool were reviewed and analyzed to create a map of applicable strain at each girth weld in the study.
MATERIAL PROPERTY, DEFECT AND OPERATING DATA ANALYSIS
Pipe populations were developed with specific characteristics that make them more compatible with hydrogen blending, or less compatible due to the respective susceptibility to hydrogen-related threats under different operating conditions.
SI developed Statistical distributions for key material properties (strength, toughness, wall thickness, etc.) and girth weld defect characteristics (length, depth, etc) using client specific and industry databases.
SI reviewed and incorporated relevant material tests performed to evaluate the effects of targeted hydrogen blend levels on the materials of interest (carbon steel base metal, longitudinal seam welds and girth welds).
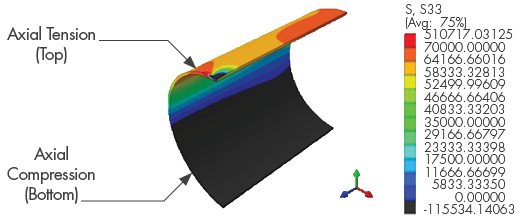
DETERMINISTIC ANALYSIS USING FINITE ELEMENT MODELING (FEM)
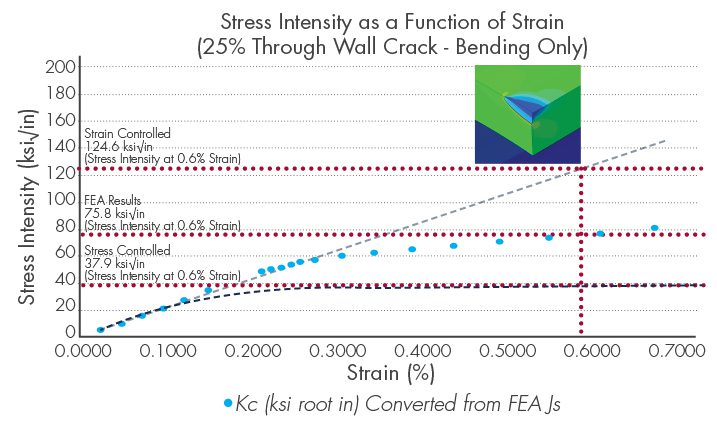
A finite element analysis was utilized to determine the stress intensity factor of a circumferentially oriented crack subjected to high bending loads resulting in large axial strain.The elastic-plastic analysis was used to determine the stress intensity factor as a function of strain, for a circumferentially oriented, externally breaking crack subject to a bending stress.
DEVELOPMENT OF A FRACTURE MECHANICS MODEL 9for probabilistic modeling)
From the FEA results a simplified elastic model was developed relating the stress intensity factor to the peak tensile axial strain resulting from bending.
SI incorporated the stress intensity factor from this model into an API 579 FAD based evaluation of girth weld, crack-like defects.
REVISIONS TO SI SYNTHESIS™ SOFTWARE
SI has developed specialized risk analysis software tools to evaluate pipeline POR which were applied to evaluate the impact or hydrogen blending to the POR.
The software was specifically enhanced for this analysis to incorporate the following items:
Evaluation of flaws associated with circumferential cracking (such as those that may be encountered in vintage girth welds).
Incorporation of secondary loads and stresses (such as those encountered through land/soil movement).
PROBABILISTIC ANALYSIS
SI applied the probabilistic framework to evaluate the increased susceptibility to failure imposed from hydrogen blending with special consideration for ground movement and girth weld defects.
This framework used Probabilistic Fracture Mechanics (PFM) and addressed the following phenomena associated with hydrogen blending:
Accelerated crack growth rates and
Hydrogen embrittlement of the pipeline steel.
The POR was then evaluated for each active threat on the pipeline, comparing the risks associated with pure natural gas service to natural gas with hydrogen blending, considering various assessment options (hydrotest or ILI) prior to hydrogen injection.
CONCLUSION
Key challenges have been identified with blending hydrogen in gas transmission pipelines.The susceptibility to failure of girth weld defects exposed to significant strain can be further exacerbated by the presence of hydrogen.SI has developed a probabilistic framework and supporting tools to complete an ECA and provide a better understanding of the threats and subsequent impact to risk posed by cracks and crack-like defects in a hydrogen blending environment.
https://www.structint.com/wp-content/uploads/2023/08/News-Views-Volume-53-An-ECA-Process-for-the-Impact-of-Hydrogen-Blending-on-Girth-Weld-Defects.jpg363668Structural Integrityhttps://www.structint.com/wp-content/uploads/2023/05/logo-name-4-930x191-1.pngStructural Integrity2023-09-06 19:24:122023-09-06 19:24:12News & Views, Volume 53 | An ECA Process for the Impact of Hydrogen Blending on Girth Weld Defects
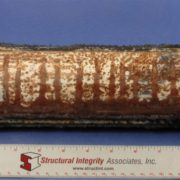
CIRCUMFERENTIAL THERMAL FATIGUE IN CONVENTIONAL WATERWALL TUBES
By: Wendy Weiss
Circumferential Thermal Fatigue damage in Conventional Waterwall Tubes most commonly appears as circumferentially oriented cracking in the waterwalls of coal-fired supercritical units. Initially, the formation of ripple magnetite was a significant factor in the formation of this damage. Later, the introduction of oxygenated treatment controlled the formation of ripple magnetite, thus greatly reducing this damage mechanism.In the early 2000s, however, this type of thermal fatigue began occurring more frequently as low NOx burners and separated overfire air systems were introduced.
Figure 1. Tube with a series of circumferential cracks
Mechanism
Three basic factors contribute to this type of thermal fatigue damage.
The first factor is the starting tube temperature (i.e., the temperature under normal operating conditions). The higher the starting temperature, the greater the accumulation of damage in the affected tubing. For example, tubes subjected to higher heat flux or tubes with thick weld overlays will have higher average metal temperatures and accumulate damage more quickly.
The second factor is the extent of gradually increasing tube temperature caused by reasons such as internal deposit buildup, flame impingement, or unstable flow.
The third factor is the contribution of thermal transients due to slag shedding or using sootblowers or water cannons.
Essentially, the thermal fatigue cracking results from the combination of increasing tube metal temperature and thermal transients and is aggravated by high starting tube temperatures.
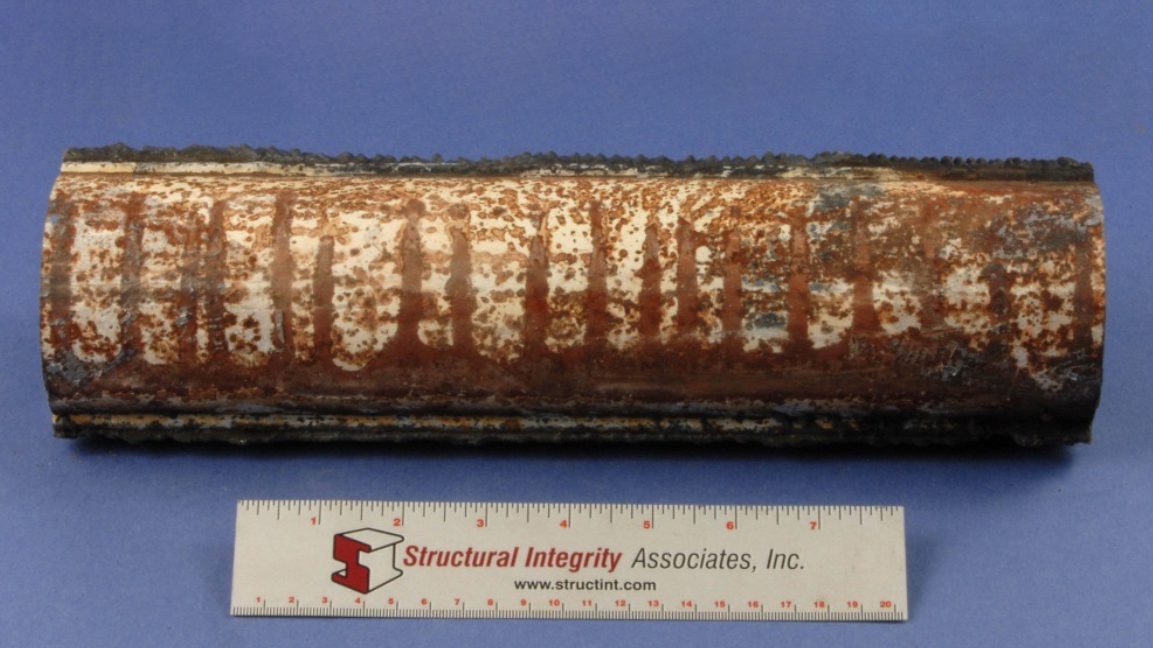
Figure 2. The external surface of the tube after the external deposits were removed
TYPICAL LOCATIONS
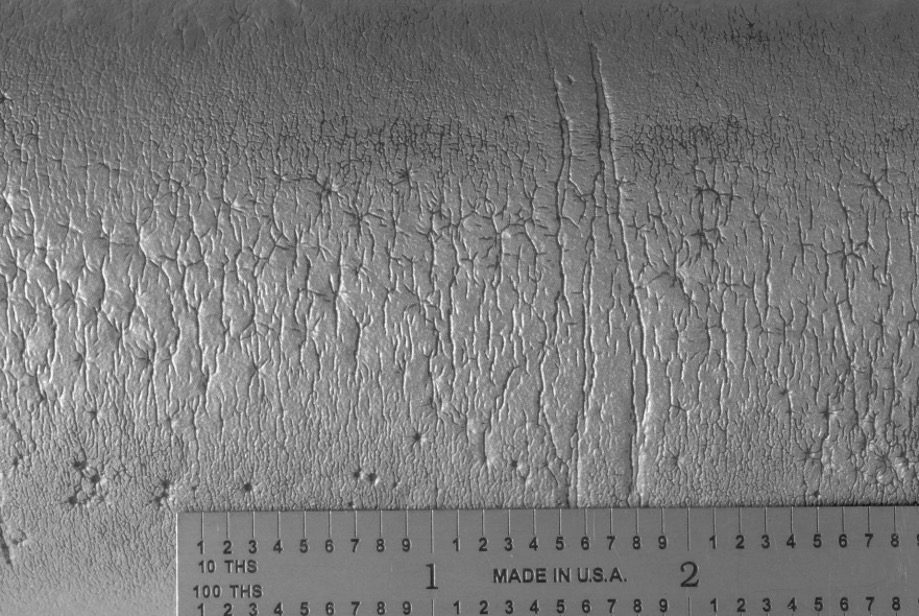
Figure 3. Cross-sectional views of the cracking in the etched (Top) and unetched (BOTTOM) conditions
Tubes with slag buildup and shedding
Areas affected by wall blow quenching
High heat flux locations
Areas affected by flame impingement
Cracking can be localized or widespread
Tends to be contained within a relatively narrow range of elevations
FEATURES
Circumferentially oriented, multiple, parallel cracks along the hot side of the tubes.
Notch shaped, oxide filled cracks in cross-section.
Adjacent tubes can exhibit variability in crack density.
ROOT CAUSES
High Initial Waterwall Tube Temperatures
Thick weld overlays
Higher heat flux
Flame impingement
Increasing Waterwall Tube Temperatures
Internal deposits including ripple magnetite, thick oxide layers, or feedwater corrosion products
Reduced internal flow rate
Formation of external oxides and deposits
Severe Thermal Transients
Natural or forced slag removal, including slag shedding and sootblowing
Use of water cannons or improper sootblowing
Flame instabilities
Unit operation, including forced fan cooling, rapid startups, frequent load cycling
Structural Integrity Associates, Inc. (SIA) is pleased to announce the appointment of Michael Battaglia as Vice President, Nuclear and Chief Nuclear Officer. Mr. Battaglia has served the prior three years leading the Project Management Office and Nuclear Business Development areas at SIA. During his 25-year career in the nuclear industry, Mr. Battaglia has held a variety of leadership roles that span operations and business development. Of Mr. Battaglia’s many operational accomplishments, building and leading the Westinghouse Balance of Plant Engineering Department, and leading the commercial deployment of a new alloy 600 mitigation technology in the US., are exemplary. In addition to his operational experience, Mr. Battaglia’s business development expertise has consistently enhanced the position of the business in the markets he has served.
Mark W. Marano, President and CEO of SIA, commented, “Mike’s blend of operational and business development backgrounds will bring a holistic approach to the implementation of the long-term strategic vision for SIA’s Nuclear business. His reputation of being highly engaged, not only with clients but with the entire staff at SIA, cements my confidence that this transition will go smoothly and pave the way for growth.”
Mr. Battaglia holds a B.S. in Industrial Engineering and an MBA from the University of Pittsburgh.
https://www.structint.com/wp-content/uploads/2023/09/Mike-Battaglia-News.jpg363668Structural Integrityhttps://www.structint.com/wp-content/uploads/2023/05/logo-name-4-930x191-1.pngStructural Integrity2023-08-21 19:34:242023-09-20 19:55:29SI Appoints New Leadership
INTRODUCTION The PEGASUS nuclear fuel behavior code features a robust 3D, finite element modeling (FEM) computational foundation capable of performing both thermo-mechanical and structural non-linear analyses within a highly versatile and customizable computational platform. The first applications of PEGASUS were for light water reactor (LWR) fuels and materials. Development work on PEGASUS has been extended to advanced fuel designs such as those proposed for Advanced Technology Fuel (ATF) LWR applications and Gen IV reactor designs, including gas and liquid metal-cooled reactors (GCRs and LMRs).
The versatility and adaptability of PEGASUS is key in enabling extensions to non-conventional operating environments, materials, fuel forms, and geometries.
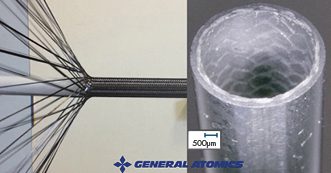
LWR APPLICATIONS SiC Cladding
Figure 1. SiGA cladding is a multi-layered composite design composed of SiC fiber in a SiC matrix.
A project is underway to further the development and irradiation testing of a composite silicon carbide matrix as an ATF cladding material. This research is supported through a DOE Funding Opportunity award (DE-FOA-0002308) for the irradiation of a composite silicon-carbide (SiC) ceramic matrix material in an existing U.S. commercial LWR. This work is led by General Atomics – Electromagnetic Systems (GA-EMS) with Structural Integrity Associates (SIA) as a primary subcontractor. For this work, PEGASUS is being adapted to model monolithic and composite SiC manufactured by GA-EMS, SiGA [1], through the incorporation of proprietary material constitutive models. PEGASUS will then be used to provide independent test performance analyses aiding in the design of the irradiation vehicle and predicted material performance. The goal of the testing is to gather irradiation data under prototypic LWR operating conditions and to inform and confirm material performance models for the SiGA-based cladding. A follow-on activity is planned to evaluate the predicted performance compared to data gathered during the post-irradiation examination phase of the project.
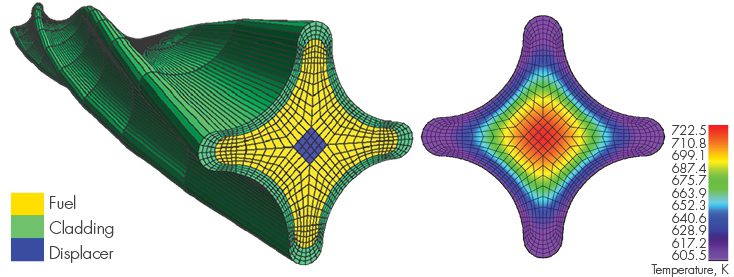
Figure 2. Lightbridge Fuel Design PEGASUS Models
Cruciform Metallic Fuel An additional fuel concept that has been explored using PEGASUS is a cruciform, extruded metallic fuel design proposed by Lightbridge Corporation [2]. This fuel is characterized by a unique multi-lobed fuel cross-section and features a U-50Zr fuel composition. Recent work has been published on fabrication testing of this proposed fuel design by Pacific Northwest National Laboratory (PNNL) [3]. PEGASUS has been used previously to prototype 2D and 3D geometric models and meshes of Lightbridge fuel and to perform fundamental temperature and stress distributions for this fuel under prototypic LWR conditions. PEGASUS has specific modeling tools designed to facilitate “extruded” 3D fuel designs that automate the meshing of these geometries. More work in this area is planned as a proposal has recently been awarded under the DOE NEUP program (DE-FOA-0002732) funding a collaborative project led by Texas A&M University along with Lightbridge, NuScale, and Structural Integrity Associates, Inc. (SI) for modeling this type of fuel for application in a LWR SMR.
URANIUM METAL ALLOY FUELS FOR SODIUM-COOLED FAST REACTORS The initial implementation of metallic alloy fuel and stainless-steel cladding material constitutive models for prototypic fast reactor fuel designs in PEGASUS has been completed. Material properties and behavioral models for U-Pu-Zr fuel and HT-9 (high Chromium, martensitic stainless steel) cladding have been added. Ongoing work includes the implementation of a gaseous swelling and fission gas release behavior model for U-Pu-Zr fuel, a Zr-redistribution model, and a fuel-cladding chemical interaction (FCCI) model that includes the effect on cladding wall thinning.
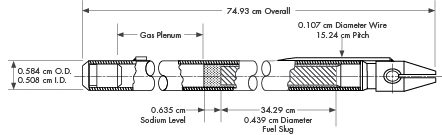
To test the implementation of these models, benchmark tests were prepared that provided comparative data for assessment of the models’ performance. Test cases were chosen from two experimental series irradiated in EBR-II: X430, a 37-pin hexagonal sub-assembly, and X441, a 61-pin bundle. These experiments were designed to test numerous fuel rod design variables and fuel response as a function of fuel alloy composition, smear density, plenum-to-fuel volume ratio, power, and coolant conditions [4]. The general experimental fuel rod design corresponds to the typical driver fuel configuration shown in Figure 3.
Figure 3. Typical EBR-II Mark-III or Mark-IIIA Fuel Element [5]
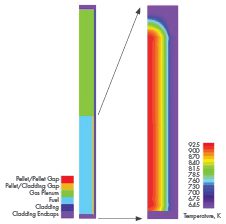
Figure 4. Left: 2D Computational Model of Rod DP2, Right: Temperature Contour Plot of the Fuel Stack Region for Rod DP21 at Peak Power (plenum region removed for detail)
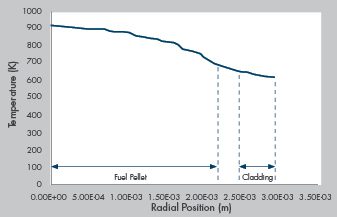
An illustration of the model and selected results from the initial analysis of rod DP21, assembly X441 are shown in the figures above. Figure 4 provides a diagram of the computational model showing the primary components of the model and a plot of the temperature distribution throughout the fueled region of the rod at peak power. Figure 5 provides the radial temperature profile across the fuel rod from the center to the cladding outer surface at peak power near the end of the irradiation period. Temperatures vary from just ~900 K at the pellet center to ~650 K at the cladding surface. The temperature differential is fairly low at ~250 K, as would be expected from a high-conductivity metal fuel rod with a Na-bonded fuel cladding gap. These results are consistent with published experimental observations.
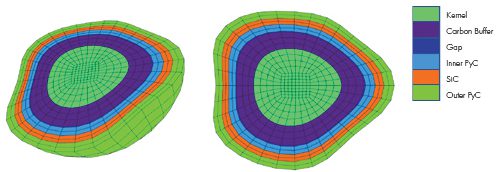
TRISO FUEL MODELING DEVELOPMENT Several advanced fuel material models have been implemented specifically for TRISO fuel in PEGASUS, including thermal and mechanical models for UCO or UO2 kernels, PyC, SiC materials, and a fission gas release model for computing the release of gaseous fission products such as Xe and Kr. In addition to the standard 3D and 2D axisymmetric modeling FEM capabilities in the code, PEGASUS contains several unique tools designed specifically to support TRISO fuel modeling and analysis. These include a “spherical mesh object” tool that can automate the process of generating 2D/3D TRISO spheres, meshing them, and embedding them into a fuel matrix to allow modeling of individual TRISO kernels or fully encapsulated TRISO fuel forms. An example of models generated using the spherical mesh object tool is shown in Figure 6. The spherical mesh object capability is, to our knowledge, unique to PEGASUS and not found in any other fuel performance or general-purpose FEM code. PEGASUS also has a “reshape” function that can automate the process of meshing and modeling deformed TRISO particles to increase user efficiency. Figure 7 illustrates particle meshes that were created using the reshape meshing tool.
These modeling capabilities allow PEGASUS to be used to investigate very detailed mechanical and structural effects in TRISO fuel forms. For example, enabling the detailed analysis of the mechanical interaction between TRISO fuel layers explicitly examining the effects of cracking, debonding, and asphericity within whole or damaged particles.
Figure 5. Radial Temperature Distribution Across the Fuel Rod Model at ~ 486 Days of Irradiation
Planned future development work includes the integration of damage-mechanics modeling and fission product diffusion in the TRISO particle, fuel compact, ad matrix. One failure mode of particular interest that has been identified is cracking of the IPyC layer which propagates through the SiC outer layer. This can create a pathway for enhanced fission product release from the TRISO particle to the surrounding fuel matrix. This failure mechansim appears to occur when the buffer layer remains bonded to the IPyC layer providing the conditions for a synergistic mechanical and chemical failure mechanism that combines cracking, stress concentration, and chemical corrosion (localized Pd-induced corrosion in the SiC [6]. This failure mode is of interest because it can have a strong impact on fuel source term determination for operational TRISO fuel.
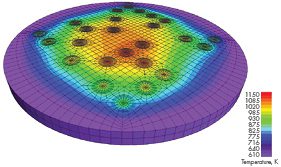
Figure 6. Temperature distribution in a cross-section of a 3D slab of a TRISO compact matrix model with a “sparse”, random kernel distribution under prototypic gas-cooled reactor conditions. (Generated using the “spherical mesh object” tool.)
SUMMARY PEGASUS is an advanced analysis tool developed for industry applications that can provide a complimentary and independent capability for nuclear fuel performance. Recent development work on PEGASUS has focused on expanding the applicability of the code to the advanced fuel (ATF) and advanced reactor arena. Future development is planned for PEGASUS that will continue along multiple avenues with an emphasis on advanced fuels and specific thermo-mechanical issues within the industry, such as deterministic failure model development. One example of this is the aforementioned Pd-induced failure mechanism identified for TRISO fuel. SI is actively seeking partners within the advanced fuel community to collaborate with on this work and would welcome inquiries and proposals for expanded application of PEGASUS.
Figure 7. Deformed 3D TRISO particle meshes generated using the “reshape” function tool in PEGASUS.
References
C. P. Deck et al., Overview of General Atomics SiGA™ SiC-SiC Composite Development for Accident Tolerant Fuel, Transactions of the American Nuclear Society, Vol. 120, Minneapolis, Minnesota, June 9–13, 2019.
J. Malone, A. Totemeier, N. Shapiro, and S.Vaidyanathan, Lightbridge Corporation’s Advanced Metallic Fuel, Nuclear Technology, Vol 180, Dec. 2012.
Z. Huber and E. Conte, Casting and Characterization of U-50Zr, PNNL-33873, Pacific Northwest National Laboratory, Richland, Washington 99354, Jan. 2023.
C. E. Lahm, J. F. Koenig, R. G. Pahl, D. L. Porter, and D. C. Crawford, “Experience with Advanced Driver Fuels in EBR-II,” J. Nucl. Mat. 204 (1993) 119-123.
G. L. Hofman, M. C. Billone, J. F. Koenig, J. M. Kramer, J. D. B. Lambert, L. Leibowitz, Y. Orechwa, D. R. Pedersen, D. L. Porter, H. Tsai, and A. E. Wright. Metallic fuels handbook, Technical Report ANL-NSE-3, Argonne National Laboratory, 2019.
J.D Hunn, C.A. Baldwin, T.J. Gerzak, F.C. Montgomery, R.N. Morris, C.M. Silva, P.A Demkowicz, J.M. Harp, and S.A. Ploger, Detection and Analysis of Particles with Failed SiC in AGR-1 Fuel Compacts, Nuclear Engineering and Design, April 2016.
The summer issue of Structural Integrity’s biannual technical newsletter, News and Views, is now available. We are excited to once again bring you this free source of technical information and advancements spanning multiple engineering disciplines and programs. In it, our expert team of Associates from our Nuclear, Energy Services, Pipeline Integrity Compliance Solutions, and Metallurgical Laboratory groups address vital topics relevant to your business.
PREPARING CLIENTS TO MEET NEW PIPELINE AND SAFETY REGULATION
By: Bruce Paskett and Erica Rutledge
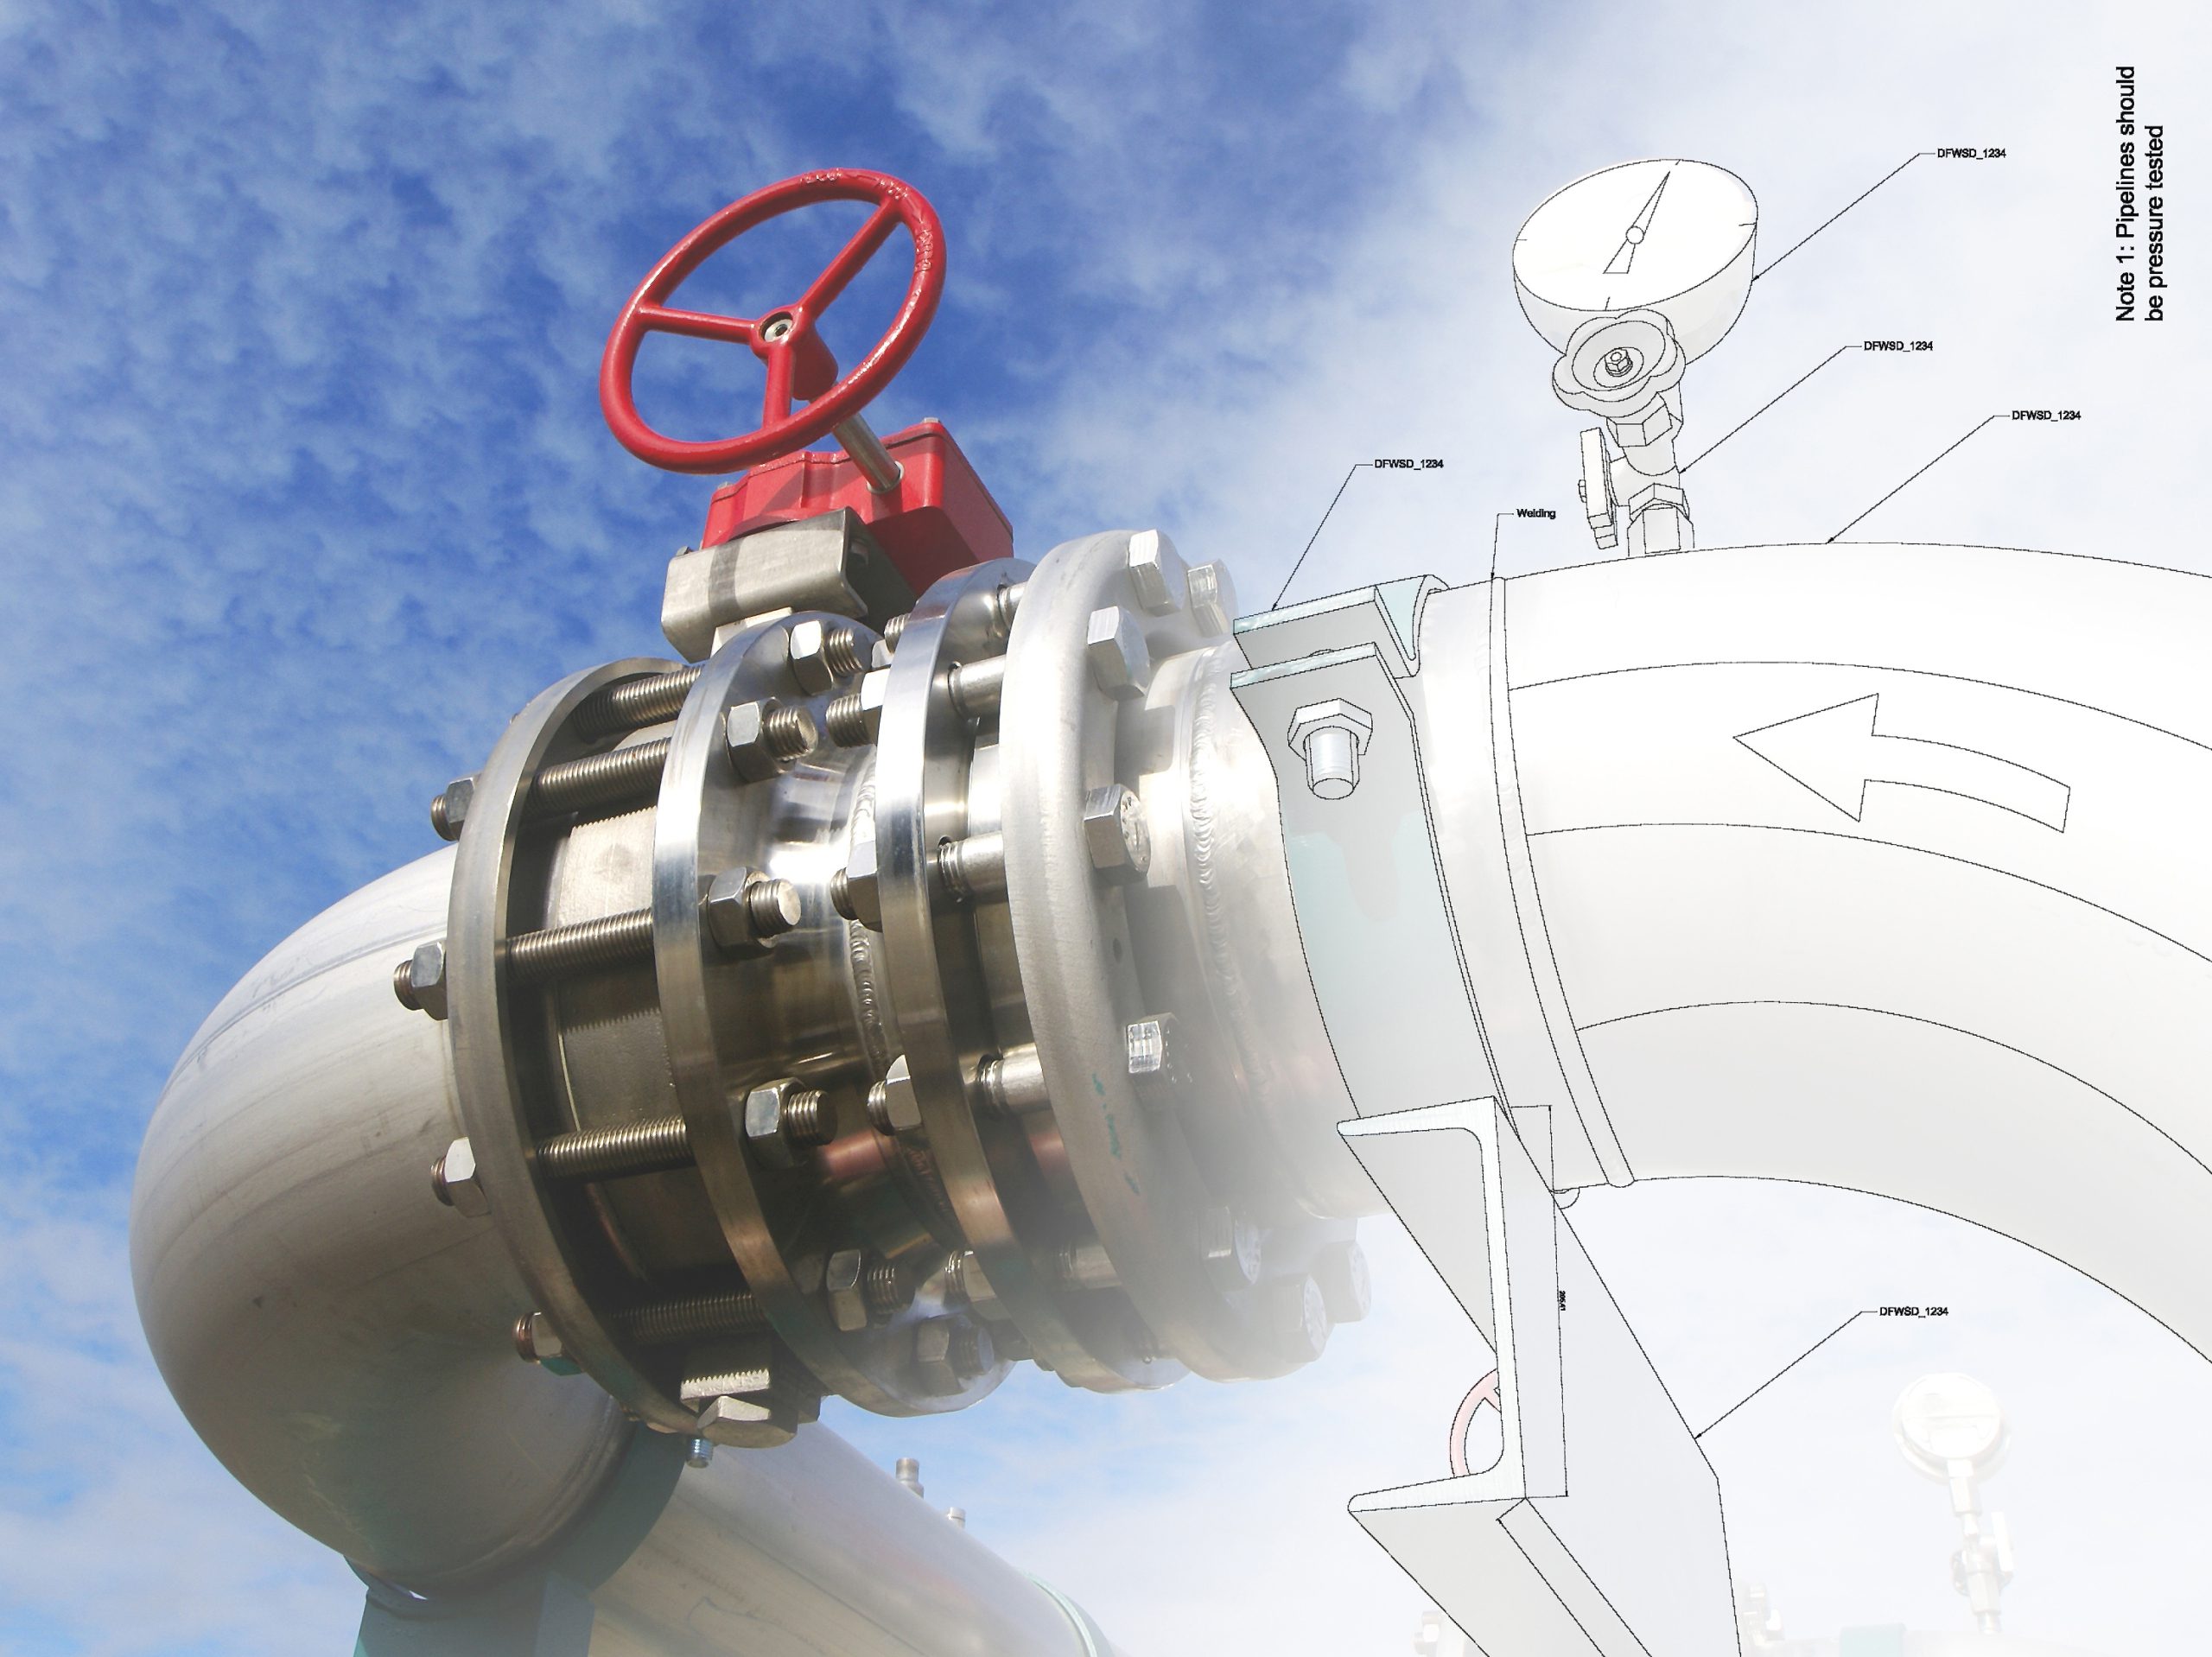
On April 8, 2022, the Pipeline and Hazardous Materials Safety Administration (PHMSA) published amendments to 49 CFR Part 192 in the Federal Register issuing new valve installation and rupture detection requirements for onshore transmission pipelines and gathering pipelines .The effective date of the Final Rule (“Valve Rule”) is October 5, 2022.
The new rule is complex and creates challenges for operators. Since 2011, Structural Integrity has been advancing practical and cost-efficient methods to address pipeline safety.
GENERAL OVERVIEW As a result of two high-profile transmission pipeline accidents in 2010 , the congressional Pipeline Safety, Regulatory Certainty, and Job Creation Act of 2011 (2011 PIPES Act) was enacted.The legislation contained several mandates for PHMSA to issue regulations addressing improvements to pipeline safety.One of the mandates required PHMSA to issue regulations for the use of Automatic Shut-off Valves (ASV) or Remote-Control Valves (RCVs), or equivalent technology, on newly constructed or replaced gas transmission pipeline facilities.
The Valve Rule addresses this congressional mandate by establishing minimum standards for the installation of Rupture Mitigation Valves (RMVs) or alternative equivalent technology (AET) on specified newly constructed or entirely replaced onshore natural gas transmission, Type A gas gathering and hazardous liquid (e.g., oil and gasoline) pipelines that have diameters of 6 inches or greater.
The Valve Rule covers the following topics:
New Definitions
Rupture Mitigation Valves (RMVs)
Changes in Class Location and Valve Spacing
Emergency Plans and Response
Failure and Incident Investigation
Notification of Potential Rupture and Response to Rupture Identification
Valve Shutoff Requirements for Rupture Mitigation
RMV Valve Maintenance
Preventative and Mitigative Measures for Pipelines in HCAs
NEW DEFINITIONS (§192.3) The Valve Rule defined “notification of potential rupture” as notification of, or observation by an operator, of the specific indications of an unintentional or uncontrolled release of a large volume of natural gas from a pipeline.PHMSA has defined “rupture identification” to mean the point when a pipeline operator has sufficient information to reasonably determine that a rupture occurred.
RUPTURE MITIGATION VALVES (RMVs) (§192.179) The Valve Rule prescribes new rupture mitigation valve (RMV) installation requirements on certain pipeline segments with diameters of six inches or greater that are constructed or “entirely replaced” after April 10, 2023 in accordance with §192.179.The RMV installation requirements only apply to entirely replaced pipelines if the addition, replacement, or removal of a valve is part of the replacement project.
“Entirely replaced” is defined as replacing two or more miles, collectively, of any contiguous five miles of pipeline during a 24-month period.
Gas pipeline segments in Class 1 or Class 2 locations that have a potential impact radius (PIR) of 150 feet or less are exempt from RMV installation requirements.
An RMV is defined as an automatic shut-off valve (ASV) or remote-control valve (RCV) “that a pipeline operator uses to minimize the volume of gas released from the pipeline and to mitigate the consequences of a rupture.”
Operators may elect to use an alternative equivalent technology (AET) in response to the RMV installation requirements if the AET provides an equivalent level of safety.This process must be demonstrated and requested by the operator in a notification pursuant to §192.18 for PHMSA review. An operator requesting use of manual valves as an AET must include in the notification submitted to PHMSA a demonstration (e.g., evidence) that installation of an RMV would be economically, technically, or operationally infeasible.
CHANGES IN CLASS LOCATION AND VALVE SPACING (§192.610) The Valve Rule also applies where class location changes occur, and gas pipeline replacements are necessary to comply with Part 192 maximum allowable operating pressure (MAOP) requirements.For Class Location changes that occur after October 5, 2022, and which are considered being entirely replaced, operators are required to comply with the valve spacing and RMV installation requirements. These valves must be installed within 24 months of the change in Class Location.
For replacements not considered entirely replaced, theoperators must either:
Comply with the valve spacing requirements in accordance with §192.179(a) for the replaced segment, or
Install or use RMVs or AETs so that the entirety of the replaced pipeline segment is between two RMVs or AETs. The distance between the RMVs/ AETs may not exceed 20 miles.
The requirements above do not apply to pipeline replacements that are less than 1,000 feet within any single continuous mile during any 24-month period.
EMERGENCY RESPONSE (§192.615(a)) In the event of a potential or confirmed transmission or distribution pipeline rupture, the Valve Rule prescribes new requirements for operators to establish and maintain communication with appropriate public safety answering points (i.e., 9-1-1 emergency call center).Operators must revise their procedures to require immediate and direct communication to 9-1-1 call centers or coordination with local government officials located in the communities and jurisdictions in which the pipeline rupture is located.
FAILURE AND INCIDENT INVESTIGATION (§192.617) In the event of a pipeline rupture involving the closure of an RMV and/or AET, an operator must conduct an analysis of the factors that may have contributed to the rupture and implement measures to minimize the consequences of a future incident.Operators must also complete a summary of the post-failure or incident review within 90 days of the incident.The summary must be signed by a senior executive officer and retained for the useful life of the pipeline.
NOTIFICATION OF POTENTIAL RUPTURE AND RESPONSE TO RUPTURE IDENTIFICATION (§192.635) The Valve Rule requires operators who identify a potential rupture or are notified directly from an external credible source(s) of a potential rupture, to take action(s) on their transmission pipeline system.“Notification of potential rupture” may be based on one or more indications such as an unanticipated pressure loss greater than 10 percent in 15 minutes or less, an unanticipated flow rate or pressure change, or a rapid release of a large volume of gas, fire, or explosion in the vicinity of the pipeline.
An operator must develop procedures documenting how it observes a potential rupture or receives notification of a potential rupture and the actions to be taken in response to a potential and confirmed rupture.Upon notification of a potential rupture, operators must evaluate the potential rupture as soon as possible to confirm if it is a rupture.
VALVE SHUTOFF REQUIREMENTS FOR RUPTURE MITIGATION (§192.636) The Valve Rule prescribes new valve shut-off requirements. After rupture confirmation, the operator must fully close any appropriate RMVs or AETs necessary to minimize the volume of gas released from a pipeline and mitigate the consequences of the rupture as soon as practicable but within 30 minutes of rupture identification. Other valves necessary to isolate the pipeline segment must be closed as soon as practicable.
VALVE MAINTENANCE (§192.745) PHMSA revised the existing §192.745 to require operators to conduct valve maintenance, inspection, and operator drill activities to ensure each RMV or AET can achieve the prescribed 30-minute valve closure time.If during the drill, the 30-minute response time is not achieved, the operator must revise its rupture response efforts as soon as practicable to achieve compliance, but no later than 12-months after the drill.Any valve found inoperable during this test must be repaired or replaced as soon as practicable but no later than 12 months after the valve is determined to be inoperable. The operator must also select an alternative valve to act as an RMV within seven calendar days.
PREVENTATIVE AND MITIGATIVE MEASURES (§192.935) The Valve Rule requires gas transmission operators to conduct a risk analysis/assessment on their transmission pipeline system to analyze whether an RMV or AET is an efficient means of adding protection to an HCA.The risk analysis/assessment must consider timing of leak detection and pipe shutdown capabilities, the type of gas being transported, operating pressure, the rate of potential release, pipeline profile, the potential for ignition, and the location of the nearest response personnel. The risk analysis/assessment must be reviewed by operator personnel at least once per calendar year, not to exceed 15 months, and certified by a senior executive.
SI PROVIDES OPERATOR SUPPORT Structural Integrity has significant expertise in pipeline safety regulatory compliance and has been heavily involved in the Valve Rule since 2011. Our dedicated and substantial resources are ready to help with specific procedures and programs, including:
Risk Analysis and Assessment of RMVs on transmission pipeline systems.
Review and update of all existing procedures impacted by the new regulatory requirements, including emergency response, valve installation, operations, and maintenance.
Development of new, comprehensive procedures and processes to support compliance with the Valve Rule, which include defining Gas Control Room responses to potential ruptures, significant gas releases, and confirmed ruptures.
References
PHMSA Pipeline Safety: Requirements of Valve Installation and Minimum Rupture Detection Standards Final Rule.
We may request cookies to be set on your device. We use cookies to let us know when you visit our websites, how you interact with us, to enrich your user experience, and to customize your relationship with our website.
Click on the different category headings to find out more. You can also change some of your preferences. Note that blocking some types of cookies may impact your experience on our websites and the services we are able to offer.
Essential Website Cookies
These cookies are strictly necessary to provide you with services available through our website and to use some of its features.
Because these cookies are strictly necessary to deliver the website, refusing them will have impact how our site functions. You always can block or delete cookies by changing your browser settings and force blocking all cookies on this website. But this will always prompt you to accept/refuse cookies when revisiting our site.
We fully respect if you want to refuse cookies but to avoid asking you again and again kindly allow us to store a cookie for that. You are free to opt out any time or opt in for other cookies to get a better experience. If you refuse cookies we will remove all set cookies in our domain.
We provide you with a list of stored cookies on your computer in our domain so you can check what we stored. Due to security reasons we are not able to show or modify cookies from other domains. You can check these in your browser security settings.
Google Analytics Cookies
These cookies collect information that is used either in aggregate form to help us understand how our website is being used or how effective our marketing campaigns are, or to help us customize our website and application for you in order to enhance your experience.
If you do not want that we track your visit to our site you can disable tracking in your browser here:
Other external services
We also use different external services like Google Webfonts, Google Maps, and external Video providers. Since these providers may collect personal data like your IP address we allow you to block them here. Please be aware that this might heavily reduce the functionality and appearance of our site. Changes will take effect once you reload the page.
Google Webfont Settings:
Google Map Settings:
Google reCaptcha Settings:
Vimeo and Youtube video embeds:
Other cookies
The following cookies are also needed - You can choose if you want to allow them:
Privacy Policy
You can read about our cookies and privacy settings in detail on our Privacy Policy Page.


 Structural Integrity Associates, Inc. (SIA) is pleased to announce the addition of Daniel (Dan) Patten as Director, Strategic Business Development. Mr. Patten comes to SIA with a diverse background in the power generation industry. Most recently, Mr. Patten served as the Fleet Engineering Manager for Energy Harbor, where he held responsibility for Fleet Programs Engineering (Buried Pipe, Flow Accelerated Corrosion, Inservice Inspection, Non-Destructive Examination, etc.), Probabilistic Risk Assessment, Life Cycle Management (for critical components), Procurement, and more. Mr. Patten has also held multiple leadership roles at PSEG, supporting critical nuclear and fossil fleet initiatives. Mr. Patten’s expertise extended into serving on multiple EPRI committees, including acting as Subgroup Chairman from 1997 through 2023 and, most recently, with the Welding and Repair Technology Committee (WRTC).


 Structural Integrity Associates, Inc. (SIA) is pleased to announce the appointment of