Heat Exchanger Tube Sheet Reliability Analysis
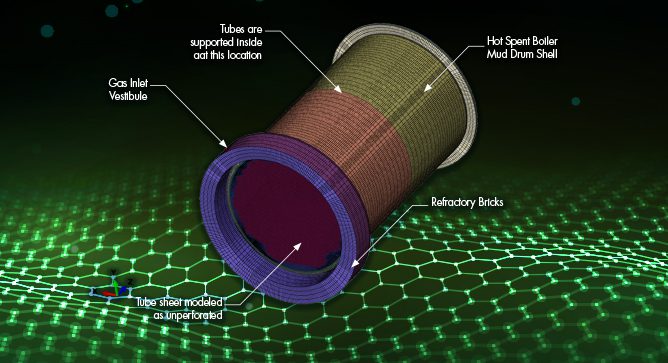
By: Kannan Subramanian, PhD, PE, FASME & Dan Parker, PE BACKGROUND The hot section of

By: Kannan Subramanian, PhD, PE, FASME & Dan Parker, PE BACKGROUND The hot section of
OIL & GAS SAFETY & RELIABILITY By: Scott Riccardella, Owen Malinowski & Dr. Pete Riccardella
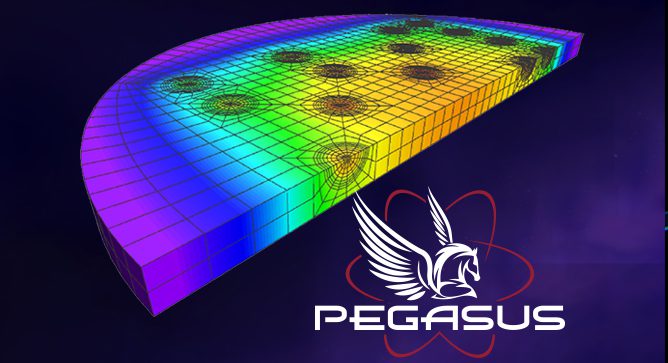
DEVELOPMENT FOR TRISO FUEL AND ADVANCED REACTOR APPLICATIONS By: Bill Lyon The Pegasus code allows
A CASE STUDY ON IMPLEMENTATION AT A 3X1 COMBINED CYCLE FACILITY (ARTICLE 1 OF 3)
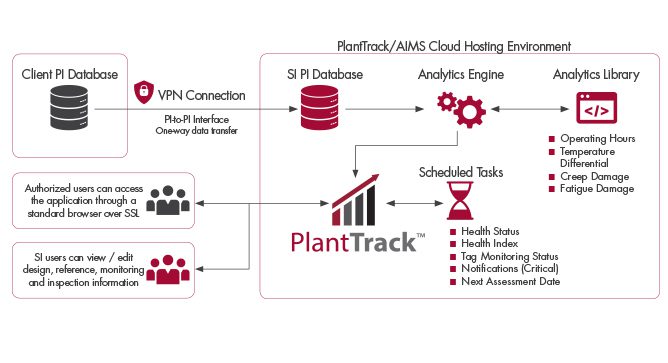
POWER PLANT ASSET MANAGEMENT SI’s technology differs from most systems by focusing on MODELING OF

January 31ST – February 2ND 2023 COURSE DESCRIPTION Our High Energy Piping (HEP) Seminar for
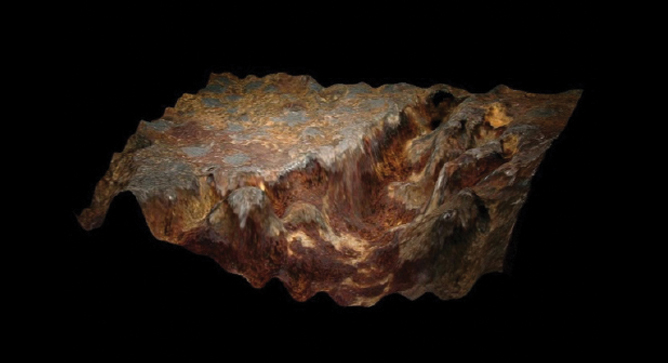
By: Clark McDonald In the world of metallurgical failure analysis, areas of interest on broken

SI EXPANDED CAPABILITIES By: Jason Van Velsor and Robert Chambers Structural Integrity (SI) has recently
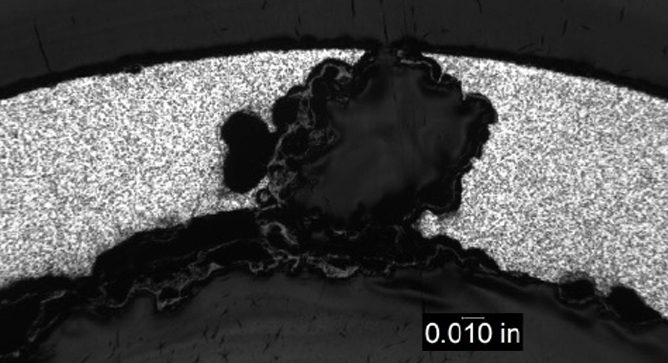
PITTING CORROSION IN CONVENTIONAL FOSSIL BOILERS AND COMBINED CYCLE/HRSGS By: Wendy Weiss Pitting is a
STREAMLINING REQUALIFICATION OF HEAVY LIFT EQUIPMENT By: Mike Battaglia and Jason Van Velsor BACKGROUND Proper