In the world of metallurgical failure analysis, areas of interest on broken parts can be colorful or drab, three-dimensional or flat, and most importantly, very big or very small.A big part of failure analysis work is telling the story, explaining the failure mode, or in some cases, showing that critical piece of evidence that explains why a metal component has failed.From wide-angled lenses to extremely high magnification scanning electron microscope imagery, documentation of failed components is a big part of the presentation.
In this edition of Structural Integrity’s Lab Corner, we wanted to provide some interesting content related to that middle-of-the-road region of magnification; closer than macro-photography but farther away than the 100X to 5000X magnifications that cover most of the applications requiring scanning electron microscopy.In other words, the comfortable world of optical microscopy, where colors, shapes, and even surface textures are part of the story.To do this, we’ve chosen some images that show the usefulness of quality optical microscopic documentation.Each of the provided examples include a brief description along with specific comments on the benefits of optical microscopy for that project, where applicable.
Figure 1. Two- and three-dimensional color images of an aluminum annode plate showing light-colored deposits that have caused uneven wastage. The 3D image shows the extent of material removal in locations where deposits are not present. Normal wastage in this application should be uniform.
Figure 2. Two- and three-dimensional color images showing fastener thread flank damage and a crack origin near the root of the upper thread. The 3D image shows that the crack origin is located on the thread flank rather than at the deepest part of the thread root.
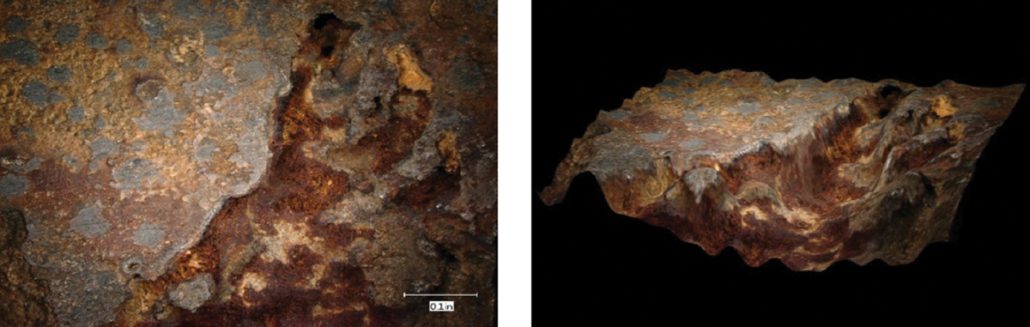
Figure 3. Two- and three-dimensional images of a copper heat exchanger tube that has been damaged from under-deposit corrosion (UDC). The image at left shows the typical appearance of the ID deposits. The center image shows a region of damage surrounding a pinhole leak. The 3D image provides an idea of the depth of internal corrosion in the tube.
Figure 4. Two- and three-dimensional images of a region of damage on an internal surface of a feedwater pump. The image at left shows the appearance of brownish deposits found within the corroded region of the pump surface. The 3D image provides an indication of the depth and shape of the corrosion damaged region.
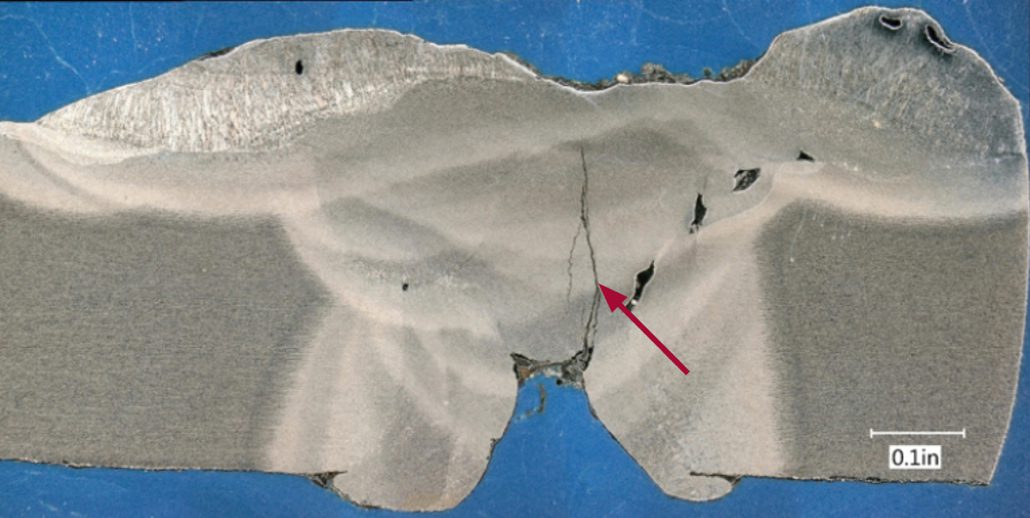
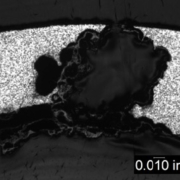
Figure 5. Two dimensional stitched image of a weld cross section showing cracking emanating from a shallow weld root. Porosity is also visible in multiple locations in the weld.
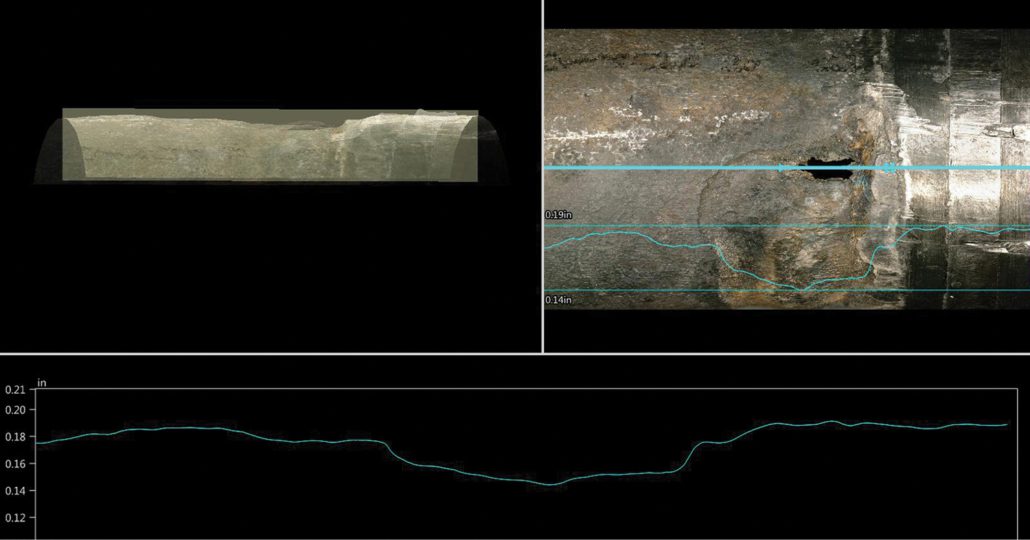
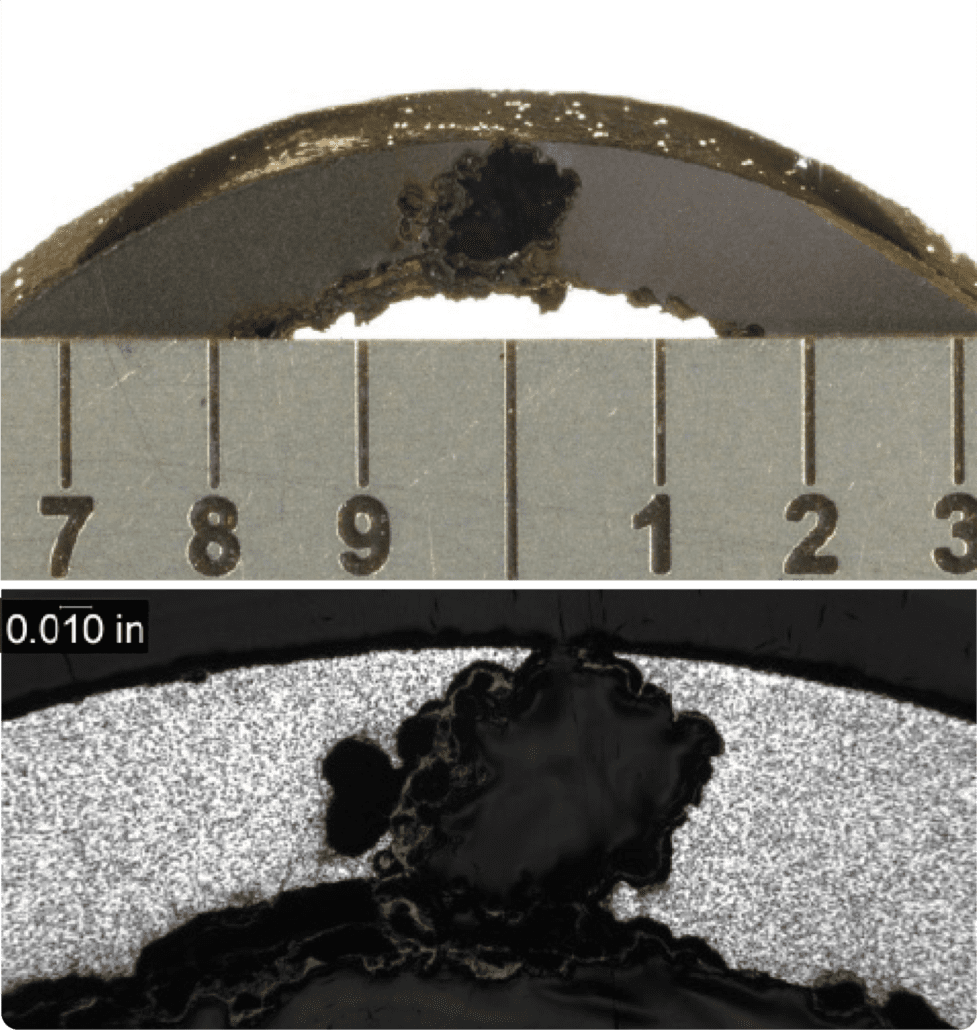
Figure 6. Images of a region of damage on the exterior of a heat exchanger tube where wastage has occurred near the tube sheet. The upper right image is a view of the leak location with an overlay of lines showing the position where the surface profile was documented as well as the depth profile (overlaid and in the lower image). The upper left image, which has an appearance similar to an x-ray, is a side view of the 3D image of the tube surface.
Structural Integrity (SI) has recently added drones to our toolbox of inspection equipment. Using drones, inspectors are able to complete visual inspections safely and more efficiently. Applications of drones for visual inspections include plant and piping walkdowns, structural inspections and atmospheric corrosion monitoring (ACM) of exposed pipeline.
Figure 1. Drone image of a dent on an elevated section of pipeline
Pipe hanger walkdowns at fossil and combined cycle plants are part of a routine inspection process. During these inspections, the inspector is required to view and mark down pipe hanger positions and assess their condition. While some hangers provide easy access for the inspector, this is not always the case. Some of these may be located in elevated positions that require the plant to build out scaffolding, which not only increases the cost, but also can put the inspector at risk when working at elevation. With the use of drones, the inspector can fly up to the pipe hangers from a safe location and get a live high-resolution video feed from the camera mounted on the drone. Saving pictures and the video footage can also allow the inspector to go back and review the footage at a later time.
ACM is another example where drones have proven to be a useful tool. ACM inspections of outdoor above ground pipelines are typically done by
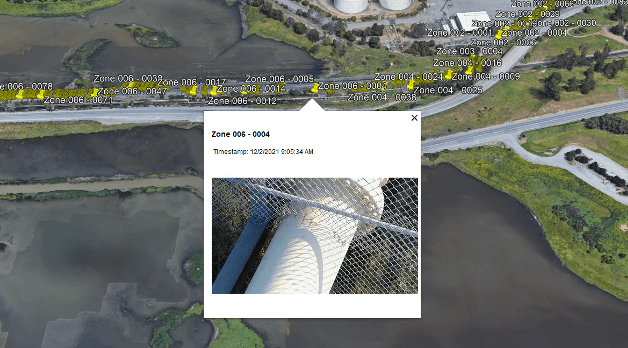
walking down the pipeline and recording any signs of atmospheric corrosion. There are many occasions where the pipeline will be elevated or cross over rivers and railroads, requiring scaffolding or fall protection. By using a drone to fly along the pipeline, the inspection can be completed much more efficiently and safely. In situations where a GPS signal is available, such as outdoor pipeline inspections, the GPS coordinates can be saved with each photo. Custom SI-developed software can then automatically compile the acquired images and create a KML file to be viewed in Google Earth, allowing the client to get an overview of the inspection results.
Figure 2. Google Earth view of image locations
Moving forward, SI plans to utilize these drones for more than just visual inspections. Possible applications could include using drones to perform ultrasonic thickness testing or Structural Integrity Pulsed Eddy Current (SIPEC™) examinations. All of SI’s pilots in command hold valid FAA Part 107 certificates and pilot registered drones.
PITTING CORROSION IN CONVENTIONAL FOSSIL BOILERS AND COMBINED CYCLE/HRSGS
By: Wendy Weiss
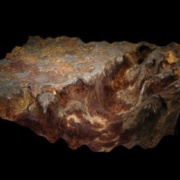
Pitting is a localized corrosion phenomenon in which a relatively small loss of metal can result in the catastrophic failure of a tube. Pitting can also be the precursor to other damage mechanisms, including corrosion fatigue and stress corrosion cracking. Pits often are small and may be filled with corrosion products or oxide, so that identification of the severity of pitting attack by visual examination can be difficult.
Figure 1. Severe pitting in a tube from a package boiler
Mechanism
Pitting is a localized corrosion attack involving dissolution of the tube metal surface in a small and well-defined area. Pitting corrosion can occur in any component in contact with water under stagnant oxygenated conditions. Pitting in economizer tubing is typically the result of poor shutdown practices that allow contact with highly-oxygenated, stagnant water. Pitting also may occur in waterwall tubing as a result of acidic attack stemming from an unsatisfactory chemical cleaning or acidic contamination.
Pits that are associated with low pH conditions tend to be numerous and spaced fairly close together. The pits tend to be deep-walled compared to the length of the defect. A breakdown of the passive metal surface initiates the pitting process under stagnant oxygenated conditions. A large potential difference develops between the small area of the initiated active pit (anode) and the passive area around the pit (cathode). The pit will grow in the presence of a concentrated salt or acidic species. The metal ion salt (M+A-) combines with water and forms a metal hydroxide and a corresponding free acid (e.g., hydrochloric acid when chloride is present). Oxygen reduction at the cathode suppresses the corrosion around the edges of the pit, but inside the pit the rate of attack increases as the local environment within the pit becomes more acidic. In the event that the surfaces along the walls of the pit are not repassivated, the rate of pit growth will continue to increase since the reaction is no longer governed by the bulk fluid environment. Pitting is frequently encountered in stagnant conditions that allow the site initiation and concentration, allowing the attack to continue.
The most common cause of pitting in steam touched tubing results from oxygen rich stagnant condensate formed during shutdown. Forced cooling and / or improper draining and venting of assemblies may result in the presence of excess moisture. The interface between the liquid and air is the area of highest susceptibility. Pitting can also be accelerated if conditions allow deposition of salts such as sodium sulfate that combine with moisture during shutdown. Volatile carryover is a function of drum pressure, while mechanical carryover can increase when operating with a high drum level or holes in the drum separators. Pitting due to the effects of sodium sulfate may occur in the reheater sections of conventional and HRSG units because the sulfate is less soluble and deposits on the internal surfaces. During shutdowns the moisture that forms then is more acidic.
Figure 2. Pitting on the ID surface of a waterwall tube
Typical Locations
In conventional units, pitting occurs in areas where condensate can form and remain as liquid during shutdown if the assemblies are not properly vented, drained, or flushed out with air or inert gas. These areas include horizontal economizer tubes and at the bottom of pendant bends or at low points in sagging horizontal tubes in steam touched tubes.
In HRSGs, damage occurs on surfaces of any component that is intentionally maintained wet during idle periods or is subject to either water retention due to incomplete draining or condensation during idle periods.
Attack from improper chemical cleaning activities is typically intensified at weld heat affected zones or where deposits may have survived the cleaning.
Features
Pits often are small in size and may be filled with corrosion products or oxide, so that identification of the severity of pitting attack by visual examination can be difficult.
Damage to affected surfaces tends to be deep relative to pit width, such that the aspect ratio is a distinguishing feature.
Root Causes
Figure 3. Pitting on the ID surface of an economizer tube
The primary factor that promotes pitting in boiler tubing is related to poor shutdown practices that allow the formation and persistence of stagnant, oxygenated water with no protective environment. Confirming the presence of stagnant water includes:
analysis of the corrosion products in and around the pit;
tube sampling in affected areas to determine the presence of localized corrosion; and
evaluation of shutdown procedures to verify that conditions promoting stagnant water exist.
Carryover of sodium sulfate and deposition in the reheater may result in the formation of acidic solutions during unprotected shutdown and can result in pitting attack. Similarly flyash may be pulled into reheater tubing under vacuum and form an acidic environment.
STREAMLINING REQUALIFICATION OF HEAVY LIFT EQUIPMENT
By: Mike Battaglia and Jason Van Velsor
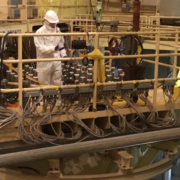
Figure 1. Heavy lift rig attached to reactor head in preparation for removal.
BACKGROUND
Proper control of heavy loads is critical in any industrial application as faulty equipment or practices can have severe consequences.The lifting technique, equipment, and operator qualifications must all meet or exceed applicable standards to ensure industrial safety.The significance of heavy lifts at commercial nuclear facilities is, perhaps, even greater.In addition to the consequences of an adverse event that are common to any industry (bodily injury or human fatality, equipment damage, etc.), the nuclear industry adds additional challenges.Such an adverse event in the nuclear industry can also affect (depending on the specific lift) fuel geometry / criticality, system shutdown capability, damage to safety systems, etc.One example of a critical lift in nuclear power facilities is the reactor vessel head / reactor internals lift.
The requirement to inspect the heavy lifting equipment for structural integrity is prescribed in NUREG-0612, Control of Heavy Loads At Nuclear Power Plants, as enforced by NRC Generic Letter 81-07. The aforementioned NUREG document describes specific requirements for special lifting devices.The requirements prescribed include:
Special lifting devices are subject to 1.5X rates load followed by visual inspection, or
Dimensional testing and non-destructive examination (NDE) of the load bearing welds
In the case of the former requirement, it can be difficult or even dangerous to test these lift rigs, which are designed to carry over 150 tons, at a factor of 1.5x.In the case of the latter requirement, employing the more traditional NDE techniques of MT, PT, and UT to inspect the lift rigs can be costly (both in terms of labor and radiological dose) and time consuming, in terms of impact to outage critical path, depending on when the inspection is performed.In PWRs or BWRs, inspections are performed in the reactor containment, or radiation-controlled area, and are typically only performed during the outage.
Ultimately, the NRC requires licensees to determine how they will comply with the NUREG requirements.One method that has been adopted (primarily by PWR plants) is Acoustic Emission (AE) testing.AE testing is a non-destructive testing process that uses high-frequency sensors to detect structure-borne sound emissions from the material or structure when under load.The process detects these acoustic emission events and, based on sensor locations and the known sound velocity and attenuation, can identify the approximate location of the sources or areas of concern.If such areas are identified, based on analysis of the data captured under load, those areas must be further investigated to characterize the indication.Such additional techniques may include surface examination (MT or PT), or volumetric UT to precisely locate, characterize, and size any indications.
Employing an advanced technique such as AE can significantly reduce the time required to perform this evolution, also reducing both the cost and dose associated with meeting the NUREG requirements.
The original deployment of this method was championed by a utility in the mid-1980’s and has since been adopted by many of PWR plants as the preferred inspection method.
APPLICATION OF AE TESTING In 2021, SI began offering AE testing services for reactor head lift rigs, including the qualified personnel, equipment, and tooling necessary to perform this work.Our first implementation was at a nuclear plant in the Southeast US in the fall of 2021, and additional implementations are contracted in the spring and fall of 2022, and beyond.
There are several advantages to AE testing that make it uniquely suited for the vessel head (or internals) lift application.First, AE is a very sensitive technique, capable of picking up emissions from anomalies that cannot be detected by traditional techniques.This allows for identifying areas of potential / future concern before they are an imminent safety danger.Second, AE sensors are capable of sensing relevant emissions from a reasonable distance (up to 10 ft or more) between source emission and sensor placement.As such, AE testing can monitor the entire lifting structure with a reasonable number of sensors (typically less than 20) placed on the structure.Thus, sensors are strategically placed on the structure where failure is most likely – i.e., the mechanical or welded connections (joints) between structural members.
This strategic sensor placement has another inherent advantage unique to the AE process.If an indication is noted, the system has the capability to isolate the approximate source location (generally within a few inches) of the emission.This is accomplished using a calculation that considers the arrival time and intensity of the acoustic emission at multiple sensor locations.This is very beneficial when an indication requiring subsequent traditional NDE is noted as specific areas can be targeted, minimizing the scope of subsequent examinations.
The ability of AE testing to rapidly screen the entire lift structure for active damage growth saves time and money over the traditional load testing and comprehensive NDE approaches.
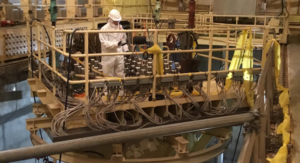
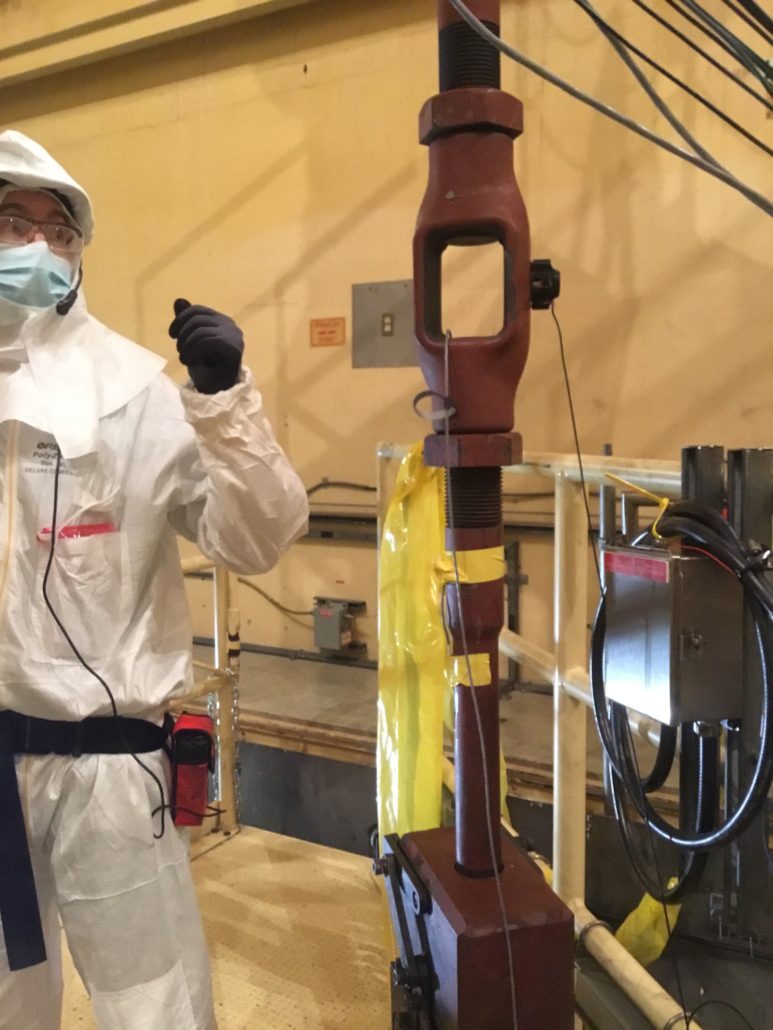
Figure 2. Lift rig turnbuckle outfitted with AE sensor.
Finally, and perhaps most importantly, the test duration is minimal and is, effectively, part of the standard process for reactor vessel head removal.Sensor placement is performed during the normal window of plant cooldown and vessel head de-tensioning, so outage critical path is not compromised.The actual test itself is performed as part of the head (or internals) lift; that is, when the head breaks from the vessel flange (and maximum load is achieved), the load is held in place for 10 minutes while monitoring for and recording acoustic emission activity.Each sensor (channel) is analyzed during the hold period and a determination is immediately made at the end of the 10-minute period as to whether the lifting rig structure is suitable for use.Unless evidence of an imminent failure is observed, the lift immediately proceeds to the head (or internals) stand.The gathered data are also analyzed on a graded basis.Depending on the energy intensity of the events detected at each sensor, subsequent recommendations may range from:‘Good-as-is’, to ‘recommend follow-up NDE post-outage’.
The basic process of implementation is:
Calibrate and test equipment offsite (factory acceptance testing)
Mount sensors and parametric instrumentation (strain gauges, impactors) during plant cooldown and de-tensioning
System check (Pencil Lead Breaks (PLBs), and impactor test)
Lift head to the point of maximum load
Hold for 10 minutes
Continue lift to stand (unless evidence of imminent failure is observed)
Final analysis / recommendations (off line, for post-outage consideration)
SI VALUE ADD During our fall 2021 implementation, SI introduced several specific process improvements overwhat has been historically performed.These advances have enhanced the process from both a quality and schedule perspective.A few of these enhancements are:
COMMERCIAL GRADE DEDICATION OF THE SYSTEM SI developed and deployed a commercial grade dedication process for the system and sensors.Often, licensees procure this work as safety-related, meaning the requirements of 10CFR50 Appendix B apply.The sensors and processing unit are commercially manufactured by a select few manufacturers that typically do not have QA programs that satisfy the requirements of 10CFR50, Appendix B. For this reason, SI developed a set of critical characteristics (sensor response, channel response to a simulated transient, etc.) and corresponding tests to validate that the system components are responding as-expected and can be adequately deployed in a safety-related application.
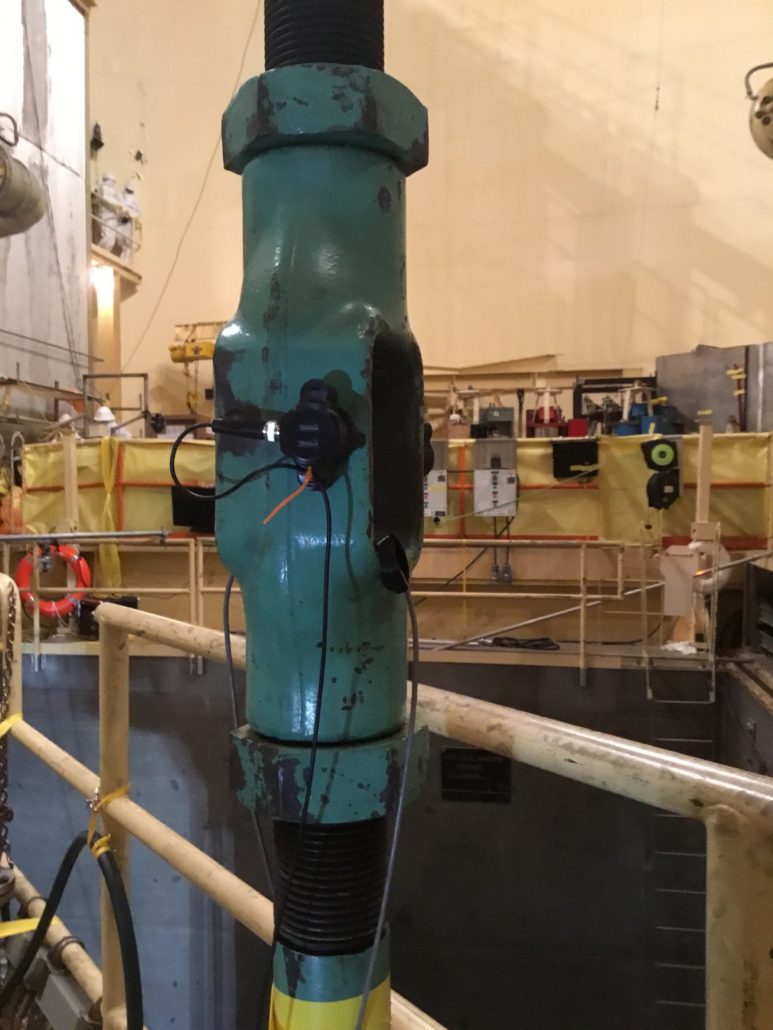
Figure 3. Close-up of AE sensor.
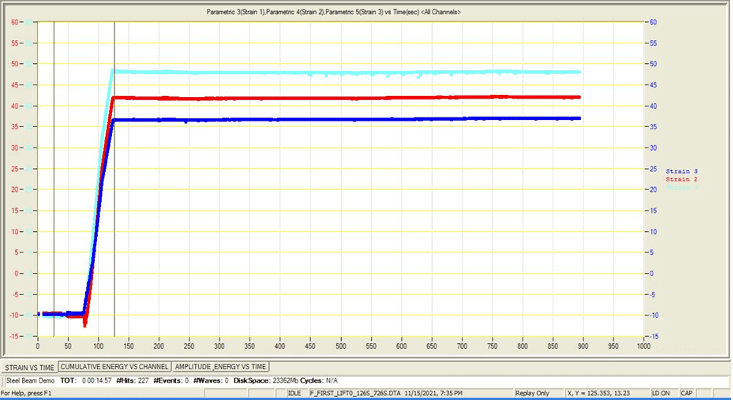
EMPLOYING STRAIN GAUGES FOR MAXIMUM LOAD The arrival time of an acoustic emission at one of the installed sensors is measured in milliseconds. For this reason, it is critical to initiate the 10-minute hold period precisely when peak load is reached. The historical method for synchronizing peak-load with the start of the hold period relied on the use of a stop-watch and video feed of the readout from the containment polar crane load cell.When the load cell appears to max out, the time is noted and marked as the commencement of the test.This approach can be non-conservative from a post-test analysis perspective as the data before the noted start time is typically not considered in the analysis. As the strain gauge correlation provides a much more precise point of maximum load that is directly synchronized with the data acquisition instrument, it is more likely that early acoustic emissions, which are often the most intense and most relevant, are correctly considered in the analysis.
REMOTELY ACTUATED IMPACTORS One of the methods used in AE testing to ensure that the sensors are properly coupled and connected is a spring-loaded center punch test.This test employs a center punch to strike the component surface, resulting in an intense sound wave that is picked up by all the sensors.However, this test has historically been performed manually and required someone to physically approach and touch the lifting equipment.In certain applications, this can be a safety or radiological dose issue and, additionally, can add time to an already time-critical plant operation.For this reason, SI has introduced the use of remotely actuated impactors to perform this function. The result is equivalent but entirely eliminates the need to have personnel on the lift equipment for the test as this task is performed remotely and safely from a parametric control center.
Figure 4. Strain gauge output showing precise timing of peak load on lift rig.
CONCLUSION Employing cutting-edge AE testing for your vessel head / internals heavy lift can save outage critical path time, reduce radiological dose, and identify structural concerns early in the process.All of this leads to inherently safer, more efficient verification of heavy lift equipment.
SI has the tools, expertise, and technology to apply cutting-edge AE testing to your heavy lifts.SI is committed to continually improving the process at every implementation.Improvements in software processing time, and setup / preparation time are currently in-process.Finally, other potential applications for the method are also possible, and we stand ready to apply to the benefit of our clients.
When a unit trips or experiences an event, the site will incur costs associated with the loss in production and regulatory penalties. Based on the severity, the outage scope may include hardware replacement and, if applicable, the purchase of make-up power. These costs can quickly drive the decision to make the return to service the only priority.
With the reduction in staffing at power plants over the past 2 decades, many traditionally routine engineering and maintenance tasks have fallen by the wayside.With limited resources, operations and engineering personnel must focus their time and efforts based on priority.Quite often, keeping a unit online or quickly returning a unit to service will take priority over continuous improvement actions such as investigations and root cause analysis.
When a unit trips or experiences an event, the site will incur costs associated with the loss in production and regulatory penalties. Based on the severity, the outage scope may include hardware replacement and, if applicable, the purchase of make-up power. These costs can quickly drive the decision to make the return to service the only priority. Unfortunately, the review of event operational data, event precursors, and the collecting evidence through the unit disassembly very often falls below the priority of returning to service.Collecting or re-creating evidence after the fact is nearly impossible.This lack of priority often results in a lack of understanding of the root cause of the trip or event.
Within large, complex plants and turbomachinery, trips or minor events are common but are rarely isolated, one-off events. Many trips and events are repetitive in nature and, worse, are early indications of a more serious event to come. While the cost of delays in returning to service may be high, the cost of not solving the root cause may be orders of magnitude higher, particularly if a failure event happens a second time.
Focusing on unit trips, best practices include:
Hold regular, cross-functional trip reviews.
If available, consider holding reviews across similar sites within a parent company.
Utilize knowledge and solutions that may already have been developed.
Trend trip events and frequency over a 1-to-3-year period.
Measure the success of prior projects based on the reduction of occurrences or elimination over a multi-year period.
Trips may be seasonal in nature, and re-occurrence may span timeframes greater than one year.
Review each trip as a near miss and assess potential consequences that may not have occurred this time.
Consider including trip investigation in site or corporate level procedures and celebrate successes.
Focusing on unit events, the cost of an event requiring an outage and hardware replacement, not including make-up power purchase, can very quickly escalate to millions of dollars. Compare that cost to the cost of a dedicated, independent resource for the duration of time required to perform a comprehensive investigation. Also, consider the cost of the investigation versus the cost of reoccurrence or a similar event with more serious consequences. The cost of the resource and investigation will almost always be in the noise of the overall cost. Best practices include:
In nearly all cases, site and outage resources will be dedicated to the speedy rehabilitation of the unit.
Critical evidence is often lost or destroyed, unintentionally, based on the need to return to service quickly.
A dedicated, independent resource provides the best option to ensure that useful evidence is collected.
Assign a dedicated, independent resource to collect and review data and findings.
If a site resource is not available, borrow from a sister site or corporate team, ideally someone with an outside perspective and not necessarily an expert in the field.
Consider an external independent resource such as an industry consultant.
It will likely require a team to complete the overall root cause analysis, however, the likelihood of success will be much greater with facts and details being collected by a dedicated resource.
Initial steps as a dedicated, independent resource:
Ensure a controller and DCS data and alarm logs backup is completed before they time out.
Interview individuals that were on site at the time of the event and or in the days prior.
There is no such thing as too many pictures. It is common to find a critical link or detail in the background of a picture taken for another reason.
Clearly articulate hold points at which the independent resource will require inspections or data collection through the disassembly process.
Collect and preserve samples and evidence.
Where available, utilize other fleet assets to enable a detailed causal analysis with corrective and preventative actions.
Demonstrating a commitment to fleet risk reduction can minimize impacts with regulators and insurers.
Once an event occurs, those limited resources will be fully occupied. Creating a plan at this point is too late.
Discuss including the cost of an investigation into an event insurance claim with site insurers and what their expectations would be to cover the cost.
Maintain a list of resources, internal and external, to call upon as dedicated, independent resources.
Identifying the root cause of an event might be cumbersome, but far less cumbersome than dealing with the same type of event on a recurring basis.
Structural Integrity has team members and laboratory facilities available to support event investigations and to act as independent consultants on an emergent basis.
A CASE STUDY FROM THE FERMILAB LONG BASELINE FACILITY
By: Keith Kubischta and Andy Coughlin, PE, SE
All around us is aging concrete infrastructure. From the dams holding back water, to the nuclear power plants creating carbon free electricity, to the foundations of our homes and offices. Though many advances have been made in the design of concrete structures, how do we know these structures will stand the test of time. Can we see the future of a concrete structure? Can we know the damage built into a structure during construction, normal life, and extreme events?
Answer:Yes we can.
Background
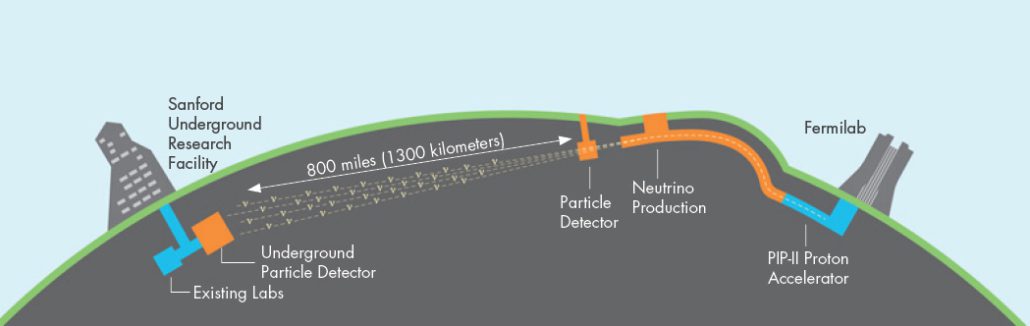
In Batavia, Illinois a facility being built that is the first of its kind in the world. Fermilab’s Long Baseline Neutrino Facility will accelerate protons using electromagnets up to incredible speeds in a particle accelerator. After traveling through the campus, the particles are redirected to a graphite target where the collision breaks them into their component particles: pions and muons. These components decay and are segregated off. What is left is believed to be the building blocks of the universe: neutrinos, which can pass undisturbed through matter. A beam of neutrinos passes through near detectors and travels over 800 miles underground to a detection facility in an old mineshaft at Sanford Underground Research Facility in South Dakota, a facility that can also detect neutrinos hitting the earth from exploding stars.
Figure 1. Fermilab Long Baseline Neutrino Facility (source https://mod.fnal.gov/mod/stillphotos/2019/0000/19-0078-02.jpg)
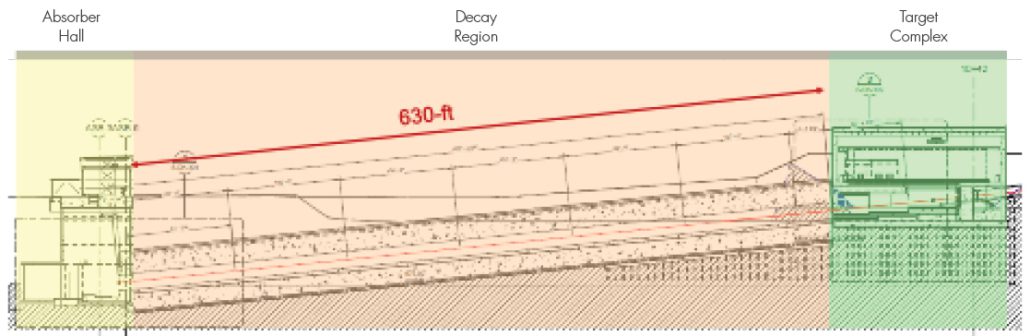
After the graphite collision what is left behind has the potential to create some harmful biproducts such as tritium, or hydrogen-3, which needs to be kept out of the surrounding atmosphere, soil, and ground water. This occurs in the decay region slightly downstream from the target complex, which is 630-ft long concrete tunnel with 18 feet of concrete surrounding the beam line. Exiting the decay tunnel any leftover particles are absorbed downstream in the absorber hall.
Figure 2. Overview of Decay Region
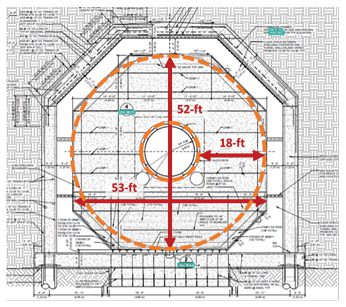
The tunnel of the decay region houses an octagonal shielding concrete structure to provide shielding for the byproducts. This octagonal structure is over fifty feet tall and wide with 42,000 cubic yards of concrete, enough concrete to construct a baseball stadium. At the center of the tunnel is a double walled stainless steel pressure vessel charged with helium on the inside and a chilled flow of nitrogen gas within the annulus. The octagonal shielding concrete structure is surrounded by an access area to inspect the structure, the outer decay tunnel walls, and the surrounding soil.
Figure 3. Typical Decay Region Tunnel Cross Section
The octagonal shape of the shielding concrete was not always so octagonal. Starting off with small steps, Structural Integrity demonstrated advanced capabilities to model thermal structural behavior of mass concrete, while developing and expanding on existing capabilities. SI’s positive impact on the early stages of the project earned us a larger role where we displayed additional capabilities to positively influence the design of the structure.
SI followed the design progression and answered some critical questions, such as:
Will the decay region be within acceptable temperatures when subject to the extreme energy deposition from the decaying particles?
What thermal expansion joints will be required to prevent cracking, and movement of the underground structures in a harmful way?
How can we best optimize the reinforcement of such a massive structure?
SI answered these questions and more through expert analysis, expanding our capabilities through proprietary simulation ranging from earlier design concepts, construction stages, and up to including a 50-year design life of the structure.
Part One of this article will look at the influence our work had of the design of the massive structure and the benefits of “seeing the cracks” before they happen.
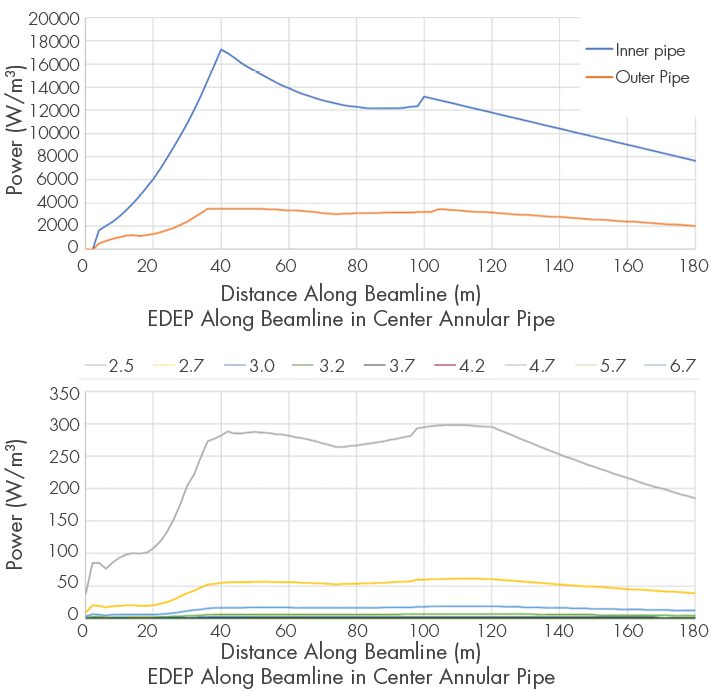
Figure 4. EDEP Axial and Radial Distribution along the Beamline
Energy Deposition and Cooling Thermodynamics
Concrete that gets too hot can vaporize the pore water and even break apart. The transfer of heat in concrete is a critical component of the analysis and is both added to the structure and removed. Thermal loading was provided by Fermilab in the form of volumetric energy deposition (EDEP) on the concrete and steel based on particle physics software simulation program MARS. The distribution of EDEP varies both radial outward from the beamline and compounded by its positioning along the length of the tunnel. SI would need to convert the distribution into a subroutine of distributed flux for use by the analysis program. The distribution was first translated for use in 2D analysis, expanded into 3D space, and then rotated in coordinate space to account for the slope of the beamline. With the EDEP adding heat to the system, chilled nitrogen is needed to remove heat.
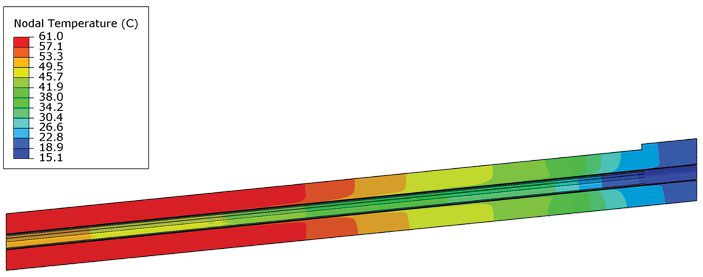
Figure 5. Accurate Thermal Distribution along the Decay Tunnel Shielding Concrete Structure.
A bit of “back-to-school” was needed to solve the thermodynamic problem. The heat transfer coefficient and temperatures of the nitrogen gas cooling system were calculated using classical methods on convection relationships in annular spaces. With the known EDEP into the concrete and steel, which dominates in regions closer to the center, it was decided as a design condition that all heat be taken by the nitrogen to obtain the outflow temperature of the nitrogen gas. The nitrogen temperature was calculated in 10m increments along the annular pressure vessel and at outflow based on an energy balance equation. The heat transfer coefficient was calculated using three different empirical relationships for Nusselt number utilizing the lower bound conservative estimate in the analysis. Our efforts created an accurate model in 3D space of the heat transfer into the shielding concrete. As a result of the nitrogen cooling system, we were able to keep concrete temperatures below the limit of 110 degrees Celsius. With the thermodynamic problem solved, SI progressed, coupling the solution to the mechanical stress model.
Concrete Capabilities
If there is one thing concrete is guaranteed to do, it is to crack. SI’s proprietary concrete constitutive model, ANACAP, is designed to predict concrete cracking and preform under various states of those cracks opening and closing. The behavior of concrete is highly nonlinear with low tensile strength, shear stiffness and strength that depend on crack widths, and plasticity compression. The main components of the concrete model utilized in the design phase analyses are tensile cracking, post-cracking shear performance, and compressive yielding when the compressive strength is reached. The use of the ANACAP concrete model has been validated and verified through 30 years of use and a key component for the nonlinear assessments.
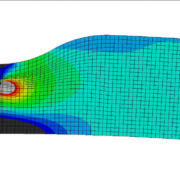
Figure 6. Stepped vs Octagonal Cross Section, Thermal Distributions and Concrete Strain (Cracking)
Influence on Design
Accurate modeling of thermodynamics / thermal analysis, coupling with the mechanical model / stress analysis, and the capabilities of the nonlinear constitutive concrete model allow for the simulation of a full 3D model of the shielding concrete under full power operations. The design team sought to minimize the cracking of the structure, monitor elongations and other movements affecting the beam line, and design connections at the structure boundaries. SI coordinated with research and design teams to facilitate several cross-section iterations with different shapes and layers of shielding. Each design iteration was analyzed to demonstrate the benefits or consequences. An early iteration of the shield concrete cross-section was a stepped block shape. The corners of the stepped cross-section displayed the potential for cracking. SI addressed this potential design trait through influencing the development of the octagonal section shape. This optimization allows the design to minimize the amount of reinforcement needed to control cracking.
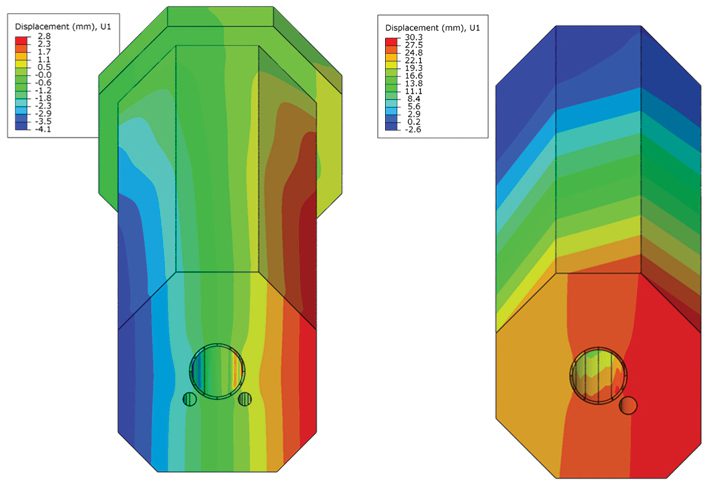
Figure 7. Lateral Displacements of Single Return Pipe and Dual Return Pipe
In addition to the cooling annulus at the center of the structure, there are the return ducts for the system to bring the nitrogen back to the target complex facility. The design initially used four return pipes spread out at four different corners. In one iteration the design team attempted to reduce the four return ducts to one larger return pipe to reduce the concrete volume required for shielding. The design iteration with one return duct was attempting to reduce costs by reducing the overall amount of concrete needed. Our calculations quickly identified unintended consequences. The asymmetrical shape was creating displacements along the transverse horizontal direction, pushing the beam alignment off-center by over an inch (~30 mm). The shape was quickly updated to be symmetric with two return pipes.
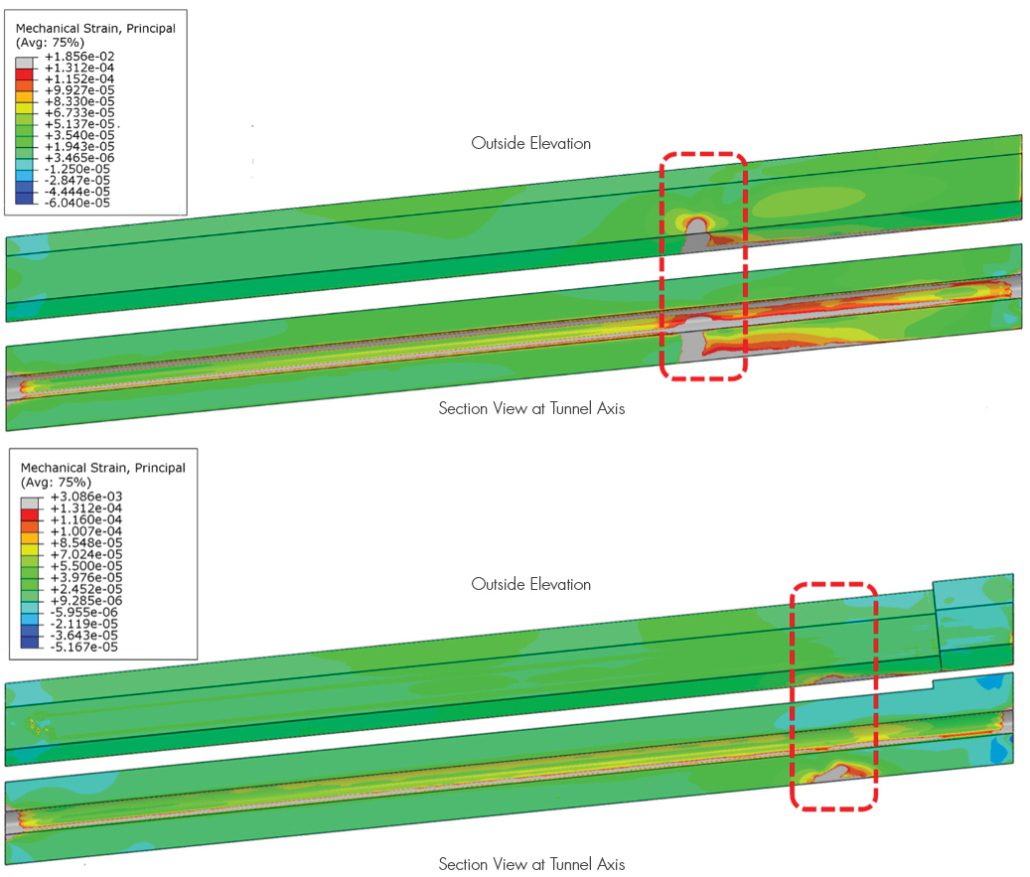
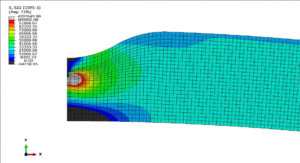
From room temperature to 60 degrees Celsius, concrete is going to expand. Traditional thermal breaks cannot be utilized in this structure to maintain continuity and provide shielding. The design needed to allow the structure to expand at the downstream end. Most of the structure is supported by rails where it was designed to freely slide at the bottom of the octagonal section during the expansion phase. A section of these rails needs to be fixed at the upstream end where it was designed to resist the gravity of the structure along the slope. SI provided valuable design influence with where the fixed rails were to be positioned as the thermal loading created immense stress at the location between the fixed boundary and sliding boundary. In the original position, SI’s calculations identified a concentrated area of cracking. To minimize the amount of cracking and additional reinforcement needed, SI proposed moving the position of restraint towards the cool / upstream end of the tunnel.
Figure 8. Effect of Fixed Rail Boundary Condition Position on Strain.
How do you stop 42,000 cubic yards of concrete from expanding?
Answer:You Don’t.
Conclusions
Structural Integrity successfully developed expanded capabilities to model thermodynamics for the energy deposition and nitrogen cooling system. SI used the capabilities of our concrete model to influence the structural design by “seeing the cracks” before they happen, making design adjustments, and reducing reliance on additional reinforcement. SI was able to give key insights for the concrete structure and potential cost savings through optimization.
Part Two of this article will look at the life of the structure form the day concrete is first poured to 30 years of power cycles. Delving into the future to see this structures test of time and monitoring methods to see if our predictions come true.
https://www.structint.com/wp-content/uploads/2022/04/Structural-Integrity-Associates-News-and-Views-Volume-51-Managing-Forecasting-the-Life-of-a-Mass-Concrete-Structure.jpg363668Structural Integrityhttps://www.structint.com/wp-content/uploads/2023/05/logo-name-4-930x191-1.pngStructural Integrity2022-04-19 16:50:362024-01-09 13:33:05News & Views, Volume 51 | Forecasting the Life of a Mass Concrete Structure, Part One
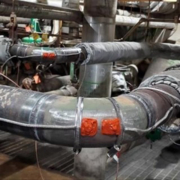
Figure 1 – Photograph of an ultrasonic thick-film array for monitoring wall-thickness over a critical area of a component.
The ability to continuously monitor component thickness at high temperatures has many benefits in the power generation industry, as well as many other industries. Most significantly, it enables condition-based inspection and maintenance, as opposed to schedule-based, which assists plant management optimizing operations and maintenance budgets and streamlining outage schedules. Furthermore, it can assist with the early identification of potential issues, which may be used to further optimize plant operations and provides ample time for contingency and repair planning.
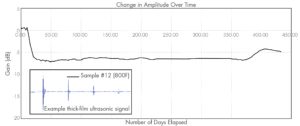
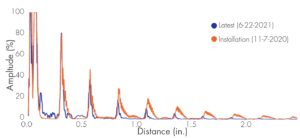
Over the last several years, Structural Integrity has been working on the development of a real-time thickness monitoring technology that utilizes robust, unobtrusive, ultrasonic thick-film sensor technology that is enabling continuous operation at temperatures up to 800°F. Figure 1 shows a photograph of an installed ultrasonic thick-film array, illustrating the low-profile, surface-conforming nature of the sensor technology. The current version of this sensor technology has been demonstrated to operate continuously for over two years at temperatures up to 800°F, as seen in the plot in Figure 2. These sensors are now offered as part of SI’s SIIQ™ intelligent monitoring system.
Figure 2 – A plot of ultrasonic signal amplitude over time for a sensor operating continuously at an atmospheric and component temperature of 800°F.
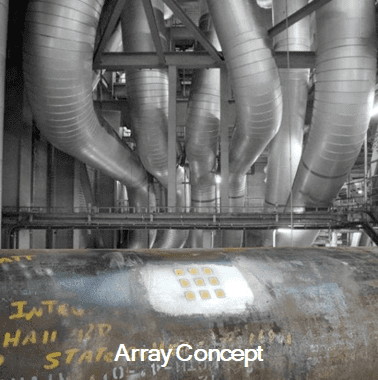
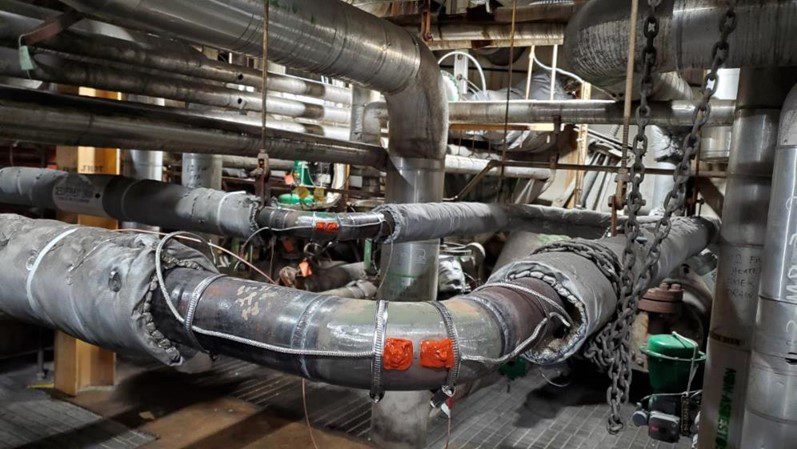
In addition to significant laboratory testing, the installation, performance, and longevity of Structural Integrity’s thick-film ultrasonic sensor technology has been demonstrated in actual operating power plant conditions, as seen in the photograph in Figure 3, where the sensors have been installed on multiple high-temperature piping components that are susceptible to wall thinning from erosion. In this application, the sensors are fabricated directly on the external surface of the pipe, covered with a protective coating, and then covered with the original piping insulation. Following installation, data can either be collected and transferred automatically using an installed data acquisition instrument, or a connection panel can be installed that permits users to periodically acquire data using a traditional off-the-shelf ultrasonic instrument.
Figure 4 shows two sets of ultrasonic data that were acquired approximately eight months apart at an operating power plant. The first data set was acquired at the time of sensor installation and the second data set was acquired after approximately eight months of typical cycling, with temperatures reaching up to ~500°F. Based on the observed change in the time-of-flight between the multiple backwall echoes observed in the signals, it is possible to determine that there has been approximately 0.005 inches of wall loss over the 8-month period. Accurately quantifying such as small loss in wall thickness can often provide meaningful insight into plant operations and processes, can provide an early indication of possible issues, and is only possible when using installed sensors.
Other potential applications of Structural Integrity’s ultrasonic thick-film sensor technology include the following:
Real-time thickness monitoring
Flow Accelerated Corrosion (FAC)
Erosion / Corrosion
Crack Monitoring
Real-time PAUT
Full Matrix Capture
Critical Area Monitoring
Other Applications
Bolt Monitoring
Guided Wave Monitoring
In addition to novel sensor technologies to generate data, Structural Integrity offers customizable asset integrity management solutions, as part of the SIIQ platform, such as PlantTrackª, for storing and managing critical data. Many of these solutions are able to connect with plant historians to gather additional data that feed our engineering-based analytical algorithms, which assist in converting data into actionable information regarding plant assets. These algorithms are based on decades of engineering consulting and assessment experience in the power generation industry.
Reach out to one of our NDE experts to learn more about SI’s cutting-edge thick-film UT technology.
Figure 3 – Photograph showing Structural Integrity’s thick-film ultrasonic sensor technology installed on two high-temperature piping elbows that are susceptible to thinning from erosion.
Figure 4 – Ultrasonic waveforms acquired approximately 8 months apart showing 0.005 inches of wall loss at the sensor location over this period.
By: Pete Riccardella, Scott Riccardella and Chris Tipple
The Structural Integrity Associates, Inc. Oil and Gas Pipeline group recently supported an Engineering Critical Assessment to assist a pipeline operator manage the Selective Seam Weld Corrosion (SSWC) threat to an operating pipeline.SSWC occurs when the fusion zone of a certain type of seam weld used in vintage (pre-1970) transmission pipelines experiences accelerated galvanic corrosion relative to the pipe body material.It has led to numerous pipeline failures because the weld fusion zone often exhibits low fracture toughness.The ECA included several technical advancements in applying fracture mechanics to this threat.
PEGASUS, a finite element fuel code developed at SIA, represents a new modeling paradigm. This new paradigm treats all fuel behavior regimes in one continuous analysis.
Introduction PEGASUS, a finite element fuel code developed at SIA, represents a new modeling paradigm.This new paradigm treats all fuel behavior regimes in one continuous analysis.This approach differs significantly from the current conservative practice of bounding analysis to ensure uncertainties are accounted for which results in sub-optimal used fuel management strategies.Using PEGASUS in used fuel evaluation results in significant savings in engineering cost and work force utilization, reduces conservatism, and provides flexibility in the management of used fuel.
From Tech Pro Research, %’s reflect rate of respondents who believe digital transformation will significantly impact indicated categories
A fundamental tenant of engineering is that where inefficiencies exist, innovation is next.This is especially true in the ongoing era of digital transformation, as software-based automation eliminates mundane, trivial tasks and enables increased focus on value-add activities.A recent poll of workers in the tech industry found that 70% of their respective companies have either committed to or are developing a transformation strategy, with varying emphases (see sidebar).The energy sector is no stranger to these innovations, and while the pace and scope of digital transformation may not appear to match that of driverless cars or moon rockets, its societal impacts are comparably widespread.
Historically, SI has been recognized as a leader in highly technical subject matter areas such as fracture mechanics, material degradation, and nondestructive examination.In many cases, this expertise is aided by digital or software innovations that enable efficient data handling, novel computer aided visualizations, and dynamic performance of complex calculations.In this vein, our MAPPro software is designed to aid in management of aging piping assets and has been an integral resource to the nuclear industry since its inception in 2009.
We may request cookies to be set on your device. We use cookies to let us know when you visit our websites, how you interact with us, to enrich your user experience, and to customize your relationship with our website.
Click on the different category headings to find out more. You can also change some of your preferences. Note that blocking some types of cookies may impact your experience on our websites and the services we are able to offer.
Essential Website Cookies
These cookies are strictly necessary to provide you with services available through our website and to use some of its features.
Because these cookies are strictly necessary to deliver the website, refusing them will have impact how our site functions. You always can block or delete cookies by changing your browser settings and force blocking all cookies on this website. But this will always prompt you to accept/refuse cookies when revisiting our site.
We fully respect if you want to refuse cookies but to avoid asking you again and again kindly allow us to store a cookie for that. You are free to opt out any time or opt in for other cookies to get a better experience. If you refuse cookies we will remove all set cookies in our domain.
We provide you with a list of stored cookies on your computer in our domain so you can check what we stored. Due to security reasons we are not able to show or modify cookies from other domains. You can check these in your browser security settings.
Google Analytics Cookies
These cookies collect information that is used either in aggregate form to help us understand how our website is being used or how effective our marketing campaigns are, or to help us customize our website and application for you in order to enhance your experience.
If you do not want that we track your visit to our site you can disable tracking in your browser here:
Other external services
We also use different external services like Google Webfonts, Google Maps, and external Video providers. Since these providers may collect personal data like your IP address we allow you to block them here. Please be aware that this might heavily reduce the functionality and appearance of our site. Changes will take effect once you reload the page.
Google Webfont Settings:
Google Map Settings:
Google reCaptcha Settings:
Vimeo and Youtube video embeds:
Other cookies
The following cookies are also needed - You can choose if you want to allow them:
Privacy Policy
You can read about our cookies and privacy settings in detail on our Privacy Policy Page.


 Structural Integrity (SI) has recently added drones to our toolbox of inspection equipment. Using drones, inspectors are able to complete visual inspections safely and more efficiently. Applications of drones for visual inspections include plant and piping walkdowns, structural inspections and atmospheric corrosion monitoring (ACM) of exposed pipeline.


 With the reduction in staffing at power plants over the past 2 decades, many traditionally routine engineering and