News and Views, Volume 54 | Benefits of High-Performance Computing for the Seismic Analysis of Critical Facilities
By Julio Garcia, PhD, PE
Abstract
Continued advances in the fields of structural and geotechnical engineering and increasing expectations for fidelity and refinement of seismic analysis models have resulted in a computational bottleneck emerging within the structural design activities for critical infrastructure. The Soil-Structure Interaction (SSI) analysis is key to characterize a realistic seismic response. Unfortunately, this is computationally demanding, given the need to characterize both the dynamic response of the structure and the site. The traditional SSI framework, System for Analysis of Soil Structure Interaction (SASSI), is a trusted analysis approach with decades of precedence. Our proprietary SSI analysis software, SC-SASSI, incorporates modern enhanced solution algorithms into SASSI and takes advantage of state-of-the-art computing, thereby drastically reducing analysis run-time.
The expanded SSI capabilities coded in SC-SASSI effectively eliminate the model size limitations of previous SASSI platforms and allow more accurate and streamlined treatment of behavior that have traditionally been neglected or often treated conservatively.
This article provides a variety of recent project examples highlighting how the enhanced solutions algorithms of SC-SASSI coupled with HPC capabilities have been leveraged, resulting in gains such as improved accuracy, reduced uncertainty, and accelerated schedules.
Introduction
Seismic analysis of critical industrial facilities requires the inclusion of the soil into the analysis model to evaluate the influence of the subgrade’s flexibility on the structure’s dynamic behavior. As a result, a soil-structure system is used for this purpose, and the consideration of the soil in the structural behavior is referred to as SSI. Industries other than nuclear also benefit from SSI consideration, both for seismic as well as for other dynamic loading conditions, like machinery vibration. For decades, the SASSI [1] program and its improved derivatives have been an accepted and favored analysis tool for the treatment of seismic SSI effects. With continued advances in the fields of structural and geotechnical engineering, and increasing detail and refinement of analysis models, SASSI has become a computational bottleneck in the design and evaluation of nuclear plant structures, and may not provide the fidelity and detail expected in modern engineering. Compared to the current state of practice for structural finite element (FE) analysis, gross model simplifications are too often perceived to be necessary to ensure reasonable analysis schedules, necessitating numerous assumptions, sensitivity studies, and additional qualitative evaluations to address specific aspects of the real seismic response.
SC-SASSI
Enhanced solution algorithms have become available since the development and widespread adoption of the original SASSI framework in the early 1980s. The commercial code, SC-SASSI [2], leverages these algorithms to efficiently take advantage of modern high-performance computing (HPC) with dramatic results. Figure 1 shows a flowchart highlighting some of the SC-SASSI improvements to the traditional SASSI. The gold boxes represent areas of key improvement and include the all-new RESPONSE module, which provides advanced postprocessing and is also a “living” module that continues to grow and adapt to the user’s needs.
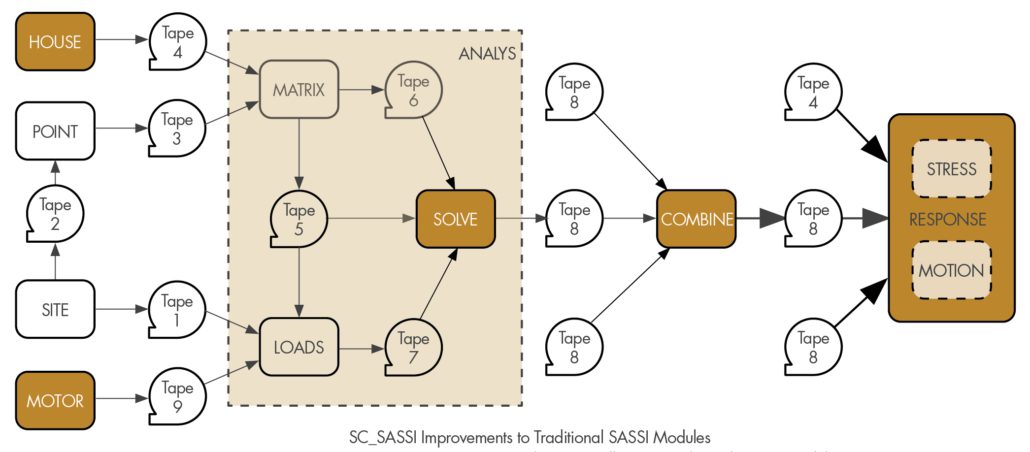
Figure 1. Key SC-SASSI Improvements (Shown in Gold) to Traditional SASSI Modules.
Expanded SASSI capabilities via HPC functionality allow two primary advantages that lead to project gains: (1) large increases in permissible model sizes (often measured as a larger number of “interaction nodes”) and (2) drastically reduced analysis run-time. The large models now possibly allow direct treatment of SSI phenomena that previously required gross simplification and/or compromise. Key advantages of the HPC enhancements for large models are the handling of features like deep embedment, high-frequency hazard, structure-soil-structure interaction, and high-fidelity models for coupled stress analysis and seismic analysis. The example outlined below demonstrates some of the gains achieved using large models.
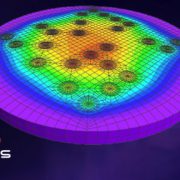
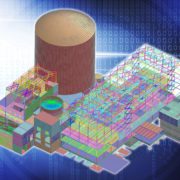
Figure 2. Example Nuclear Power Facility FE Model with Direct Consideration of SSSI.
Structure-Soil-Structure Interaction (SSSI)
An ideal example to demonstrate SSSI is that of a Nuclear power generating station. Typically, these sites have multiple structures located near one another, each with components critical to the facility’s safe operation. The SSI behavior of one structure can affect the SSI behavior of an adjacent structure, referred to as structure-soil-structure interaction (SSSI). Direct consideration of SSSI for multiple large structures has been impractical with traditional SASSI, necessitating the use of 2D “slice” SSSI models or “cascade analysis” techniques. These simplifications seek to reduce the size of the model(s) used to evaluate SSSI effects and/or avoid excessive computer run-times. However, they often insert significant inefficiencies (by way of required benchmarking analysis or decoupled, multi-step analyses) and thus remove realism.
In contrast, SASSI with HPC provides efficiency to include multiple structures in the same SSI model, thus directly capturing SSSI effects. In these direct SSSI models, entire multi-building nuclear island complexes have been incorporated into a single analysis run regardless of separation distance, soil properties, foundation depths, etc. The benefits of direct treatment of SSSI effects include: (a) captures full 3D effects of SSSI behavior on adjacent structures and spatially variable amplitude of SSSI effects; (b) captures two-way feedback between adjacent structures; (c) minimizes the number of separate sensitivity study models to generate and maintain; and (d) allows more streamlined calculation of the relative displacements between adjacent structures.
An example multi-building FE model for direct consideration of SSSI effects in SC-SASSI is illustrated in Figure 2. This pressurized water reactor (PWR) complex [3] combines multiple buildings including the containment building, auxiliary building, radwaste building, turbine building, and intake structure into a single model. In addition to capturing traditional SSSI effects, the combined model allowed consideration for partially shared load paths between adjacent structures, shared foundations despite separate super-structures, and relative movement between adjacent structures (to directly assess the potential for building impacts and failure of commodities spanning across seismic joints).
Benefits for Short Computational Times
HPC enhancements in SC-SASSI also allow much faster SSI analysis run-times than were possible with traditional SASSI. The rapid analysis now allows more rigorous treatment of considerations that previously were handled via a sensitivity study or by the enveloping response of bounding cases. Key advantages of the HPC enhancements for shortening the computational times are the handling of features like probabilistic SSI analysis, multiple configurations, and/or alternate boundary conditions (like spent fuel installation facilities that may be analyzed under different cask loading configurations), as well as multiple hazard levels (i.e., design basis and beyond design basis earthquakes). The example outlined below demonstrates gains achieved using rapid analysis.
Probabilistic SSI Analysis
Probabilistic SSI analysis is advantageous over more traditional deterministic methods since it can directly address the inherent uncertainties related to the seismic input motion, soil and structural material behavior, and modeling assumptions. These uncertainties are directly addressed in the probabilistic SSI through randomization of the seismic input motions as well as soil and structural stiffness and damping. However, a drawback in probabilistic SSI analysis is the number of SSI models that are needed to obtain stable and reliable results, and the perceived computational effort associated with analysis of these various models. In practice, at least 30 SSI models are needed using the Latin Hypercube Sampling (LHS) method for the generation of SSI models. For this reason, many structures have traditionally been either analyzed using a deterministic approach or overly simplified for probabilistic analysis to achieve reasonable computational run-time. The use of HPC can mitigate this drawback by significantly reducing the analysis run-time, thus making it feasible to utilize detailed models for probabilistic analysis.
By covering realistic variability of key inputs like soil, structure, and ground motion, probabilistic SSI analyses provide a range of expected structural response results that allow easy identification of either realistic or conservative responses, according to the objective of the evaluation; this represents a significant advantage over deterministic analysis.
The case described below provides an example where probabilistic SSI analyses were used to obtain realistic responses for the purpose of fragility analysis of structures, systems, and components (SSCs) in a nuclear power plant [3]. Each of the 30 probabilistic SSI cases, which included variation of the soil, structural stiffness, damping, and earthquake ground motion, was run for each model. All 30 SSI cases were run in less than one day for each model. These analyses generated 30 In-Structure Response Spectra (ISRS) for each of the selected locations, and the median and 80th percentile spectra were directly extracted. The response spectra variability (βRS), which often must be assumed in fragility calculations, could be directly and accurately calculated for each set of ISRS. Results post-processing is efficiently automated in SC-SASSI. Figure 3 illustrates each resulting ISRS and their post-processing for a typical location.
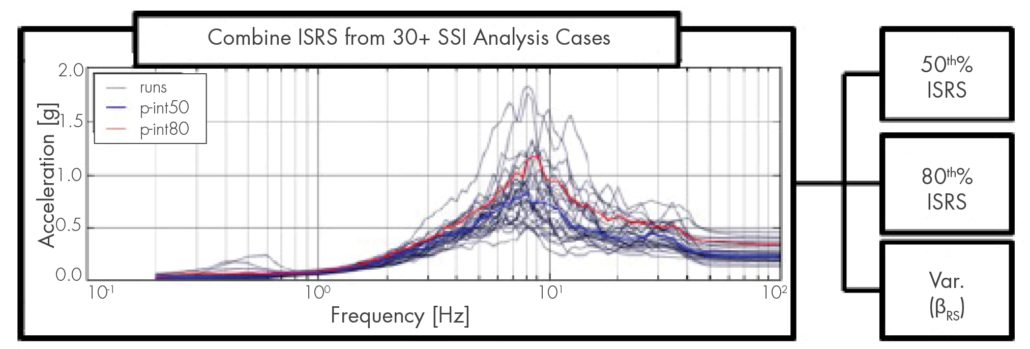
Figure 3. Example Calculation of Median and 80th% ISRS from Suite of Probabilistic Results.
Ground Motion Incoherence
SC-SASSI offers additional useful features, like ground motion incoherence effects. Ground motion incoherence refers to the spatial variation of the ground motion. In other words, there are differences in the ground motion experienced by two points separated by some distance; the larger the distance, the larger the variability. Considering the effects of ground motion incoherency in SSI analysis enhances the realism of predicted structural response and generally reduces high-frequency response. The relative significance of this refinement depends on several factors, including the foundation input motion’s high-frequency energy content and the foundation footprint’s size. The inclusion of ground motion incoherence in SASSI requires additional computational effort versus coherent ground motion. A common approach in the industry to minimize the additional computational effort is to limit the number of coherency modes in the analysis to some minimum number of modes that can still capture realistic SSI behavior. However, the industry debates on how many modes are sufficient under different conditions. HPC capabilities in SC-SASSI mitigate the computational penalty for maintaining many coherency modes, thus allowing consideration of many modes, even for large and complex structures.
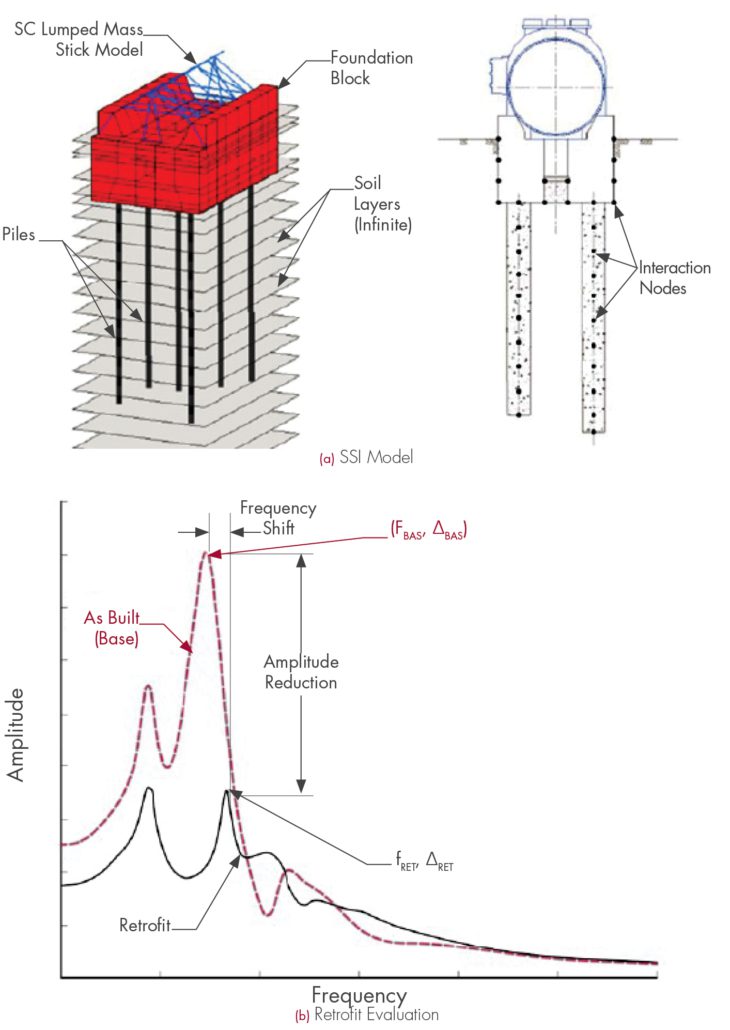
Figure 4. Synchronous Condenser on Pile Foundations and Retrofit Evaluation.
Industrial Facilities on Pile Foundations
Pile foundations are frequently used in industrial facilities. While their static analysis and design are widely understood and applied in practice, the contribution to the dynamic response of piles is often neglected, leading to a mischaracterization of the response, like in the case portrayed below.
At the subject hydroelectric generation facility, the synchronous condenser, responsible for adjusting the electric power before it gets input into the transmission grid, experienced undesirable vibration levels during its initial stages of operation. The source of the high vibration levels is attributed to the resonant dynamic interaction between the condenser, its foundation, and the supporting soil media, which went undetected during the initial design process. The foundation of the condenser consists of a massive reinforced concrete block supported on steel casing piles with reinforced concrete infill.
A detailed three-dimensional finite element SSI model was developed to accurately represent the interaction between forces, structure, soil, and foundation, as displayed in Figure 4a. The model was analyzed using the computer software SC-SASSI, including the recently implemented and validated pile elements. The SSI analysis was able to diagnose the problem, and it also served to evaluate feasible remediation solutions (see Figure 4b). The selection of the retrofit solution was performed with the objectives of (1) reducing vibration amplitudes, (2) shifting the system frequency away from the operation frequency, both (1) and (2) being achieved by increasing the system stiffness and therefore minimizing potential resonance conditions, and (3) minimizing the disruption of the surrounding critical equipment already installed.
Conclusions
Since SASSI’s development and widespread adoption, enhanced solution algorithms have become available. SC-SASSI has incorporated these into the trusted SASSI framework to efficiently take advantage of modern high-performance computing (HPC). Leveraging SC-SASSI to fully utilize HPC can lead to dramatic project gains with reduced schedules, improved realism, and often more targeted, less conservative solutions.
Expanded SASSI capabilities via HPC functionality allow two primary advantages that lead to project gains: (1) large increases in permissible model sizes and (2) drastically reduced analysis run-time. These two primary advantages allow direct and rigorous treatment of SSI phenomena that previously required gross simplification, compromise, sensitivity studies, and/or overly conservative assumptions. More specifically, SASSI with HPC allows project improvements in areas such as (a) deep embedment with soft soil and high-frequency hazard, (b) structure-soil-structure interaction, (c) combined high-fidelity models for coupled stress analysis and seismic analysis, (d) probabilistic SSI analysis, (e) multiple configurations and/or alternate boundary conditions, (f) multiple hazard levels, (g) pile foundations, and (h) ground motion incoherency effects.
Project examples illustrated in this article demonstrate that the HPC capabilities in SC-SASSI allow treatment of complex SSI phenomena more rigorously and realistically than traditional SASSI approaches, while at the same time offering faster and more efficient analyses. When implemented to their maximum potential, HPC enhancements in SC-SASSI can lead to project gains by reducing cost, schedule, and risk.
References
- Lysmer, J., Tabatabaie, M., Tajirian, F., Vahdani, S., and Ostadan, F. “SASSI – A system for analysis of soil-structure interaction”. Technical Report UCB/GT/81-02, Geotechnical Engineering, University of California, Berkeley, 1981.
- SC Solutions, Inc. “SC-SASSI Manual, Version 2.3.2”. Sunnyvale, California, 2018.
- Kosbab, B., Garcia, J., Li, W., Tran, H., Talebinejad, I., Bassam, A., and Tilow, K. “Soil-Structure Interaction: Project Gains through use of High-Performance Computing”. Transactions, SMiRT-24, Busan, Korea, 2017.


 BACKGROUND